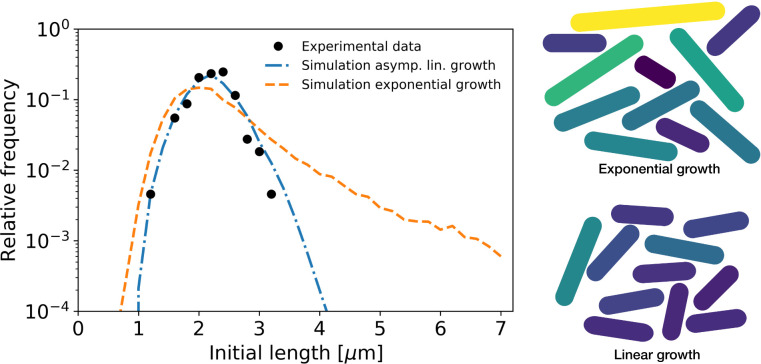
Figure 7. Simulation of population growth for asymptotically linear and exponential growth.
Left: birth length distribution for simulated asymptotically linear growth (blue dash-dotted line), and for simulated exponential growth (orange dashed line). For both simulations, all relevant growth parameters and distributions are obtained directly from the experimental data. Black dots: experimental birth length distribution. Right: sample of 11 cells from the exponential and asymptotically linear growth simulations, color coded according to length.

