
9.
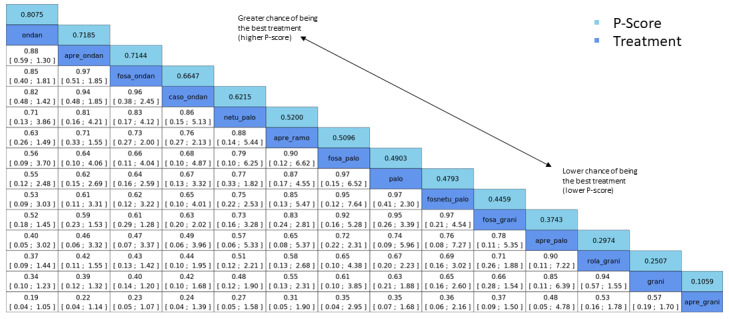
League table for the outcome serious adverse events (HEC). Network estimates with 95% CIs are given. Descending P score shows ranking of treatment options. Statistically significant results are marked in yellow. Global approach to check inconsistency/heterogeneity: Q‐statistics, I².
No. of studies: 20. No. of treatments: 12. No. of pair‐wise comparisons: 22. No. of designs: 13.
Qtotal = 20.26, df = 9, P = 0.016/Qwithin = 16.39, df = 7, P = 0.022/Qbetween = 3.87, df = 2, P = 0.14; I² = 55.6%, Tau² = 0.1057. Treatment effects + 95% CIs (risk ratios, random‐effects model).
A list of treatment abbreviations is provided in Table 5; all treatments included a corticosteroid.