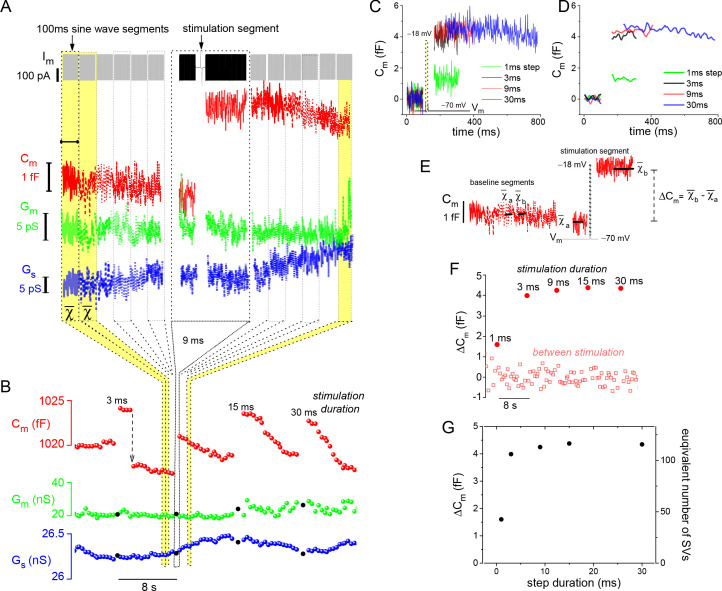
Figure 2. Resolution and analysis of evoked ΔCm.
(A) The Im presented at the top of the figure is dominated by the sine-wave voltage protocol used to derive the lock-in amplifier outputs: Cm, Gm, and Gs. The protocol consisted of a series of 100 ms sine-wave segments presented in gray, which bracket the stimulation segment depicted in black (arrow points to the 9 ms depolarizing voltage step). (B) Responses to a series of step depolarizations for the indicated durations are presented. The approach used to bin the data in (A) and create the plot in (B) are illustrated schematically. The Gm and Gs data points that are filled in black mark the stimulation segments. The dashed, downward pointing arrow following the 3 ms stimulation highlights an unusually large endocytotic, downward step in Cm (see text). (C, D) Plot the individual Cm traces for each evoked response. Traces in (D) were low-pass filtered to a corner frequency (fc) of 20 Hz, and in (C) a fc of 200 Hz was used. (E) Illustrates how ΔCm was quantified over both baseline (between stimulation) and stimulation segments (see Materials and methods). (F) Chronological plot of ΔCm during baseline and stimulation segments. (G) Summary plot with two y-axes: ‘ΔCm’ and ‘equivalent number of SVs,’ versus step duration (x-axis). The conversion factor for calculating the number of SVs is described in Materials and methods. The ICa traces measured from this cell are presented in Figure 1C. SV, synaptic vesicle.

