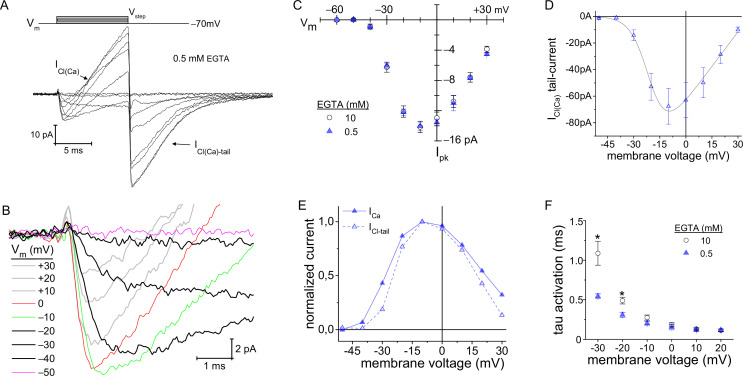
Figure 4. Lowering intracellular Ca2+-buffering accelerated Cav channel activation kinetics.
(A, B) With 0.5 mM EGTA in the pipette, an outward current developed during the Vstep (designated as ICl(Ca)), which became an inward current upon repolarization (ICl(Ca)-tail). (B) Expanded view of the activation portion of the current traces from (A). Traces from 8 cells were averaged; depolarization protocol is described in Figure 3A. (C) Overlay of average peak-ICa plotted over Vstep made from experiments with an intracellular concentration of either 0.5 (8 cells) or 10 mM EGTA . (D) Average ICl(Ca)-tails versus Vstep (6 cells). Modified Boltzmann I-V fit (blue trace): V1/2: −20.4±0.5, slope (dx): −5.6±1 mV/e, Vrev: +35.8±3.8 mV and Gmax: 1.41±0.44 pA-mV−1 (6 cells; see Supplementary file 4). (E) Normalized average ICl(Ca) and peak-ICa from 0.5 EGTA data in (C, D) plotted over Vstep (error bars excluded). (F) Plot of τactivation versus Vstep with an intracellular concentration of either 0.5 or 10 mM EGTA (*: p≤0.006; see Supplementary file 2).

