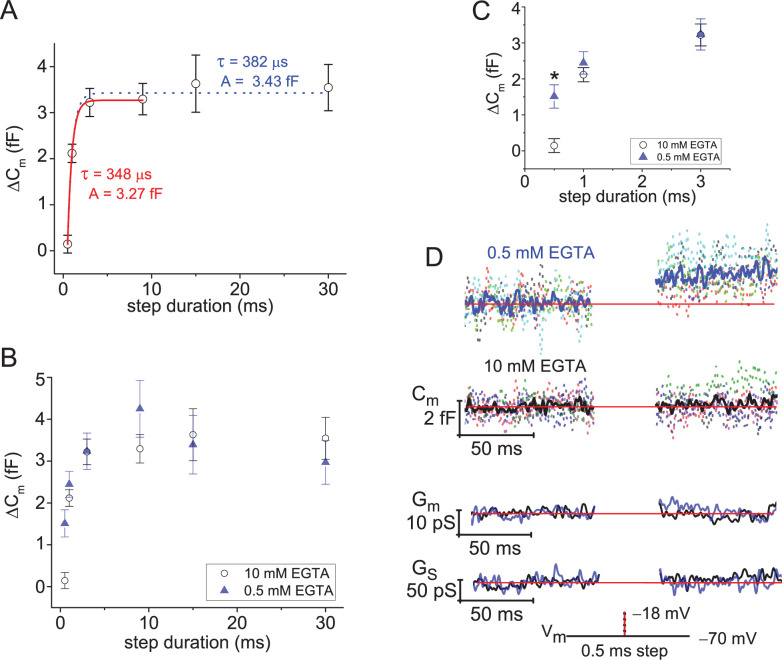
Figure 5. Ultrafast depletion of the RRP of SVs.
(A) Average ΔCm measured from rods filled with 10 mM EGTA and stimulated with a Vstep to −18 mV for durations from 0.5 to 30 ms. Single exponential fits to points from 0.5 to 9 ms (red curve), and from 0.5 to 30 ms (dotted curve). Stimulations were delivered in ascending order, and only a single cycle per cell. (B) Comparison of ΔCm derived from experiments with 0.5 or 10 mM EGTA in the pipette; voltage step durations: 0.5–30 ms. (C) Highlights the more rapid ΔCm at the singular time point of 0.5 ms when rods were loaded with 0.5 mM EGTA (*, p: 0.0016; 6 and 8 cells for 0.5 and 10 mM EGTA, respectively). (D) Summary of lock-in amplifier traces recorded during 0.5 ms step depolarizations with either 0.5 or 10 mM EGTA in the pipette (6 and 8 cells, respectively). Dashed Cm traces represent an overlay of individual recordings (cells; each a different color), and the Cm trace presented in bold font represents the average response. Only an overlay of the average responses in low and high EGTA are presented for Gm and Gs with the blue traces corresponding to 0.5 mM EGTA and black traces corresponding to 10 mM EGTA. RRP, readily releasable pool; SV, synaptic vesicle.

