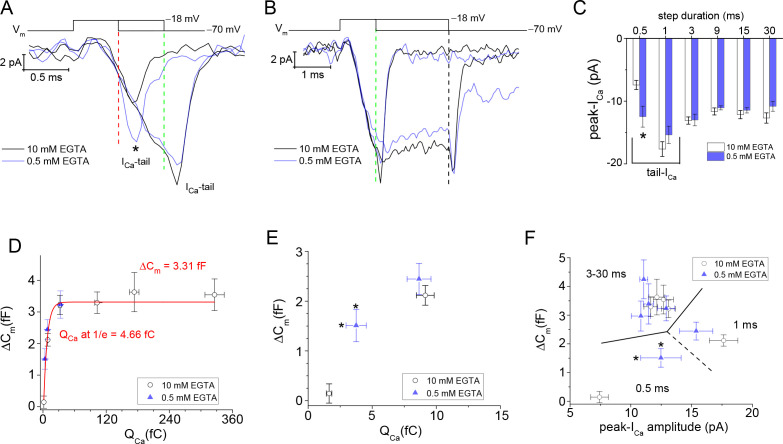
Figure 6. ICa facilitation expedites depletion of the RRP.
(A, B) Overlay of average ICa traces in response to step durations of 0.5, 1, and 3 ms (*; sign. diff., p: 0.008). Vertical dashed lines indicate the moment of repolarization. (C) Comparison of average peak-ICa derived from high and low intracellular EGTA. Only voltage steps for 0.5 ms were statistically different when comparing different EGTA levels (p: 0.008; see text). The 0.5 and 1 ms steps were dominated by their tail-currents, which is why their amplitudes varied from step durations ≥3 ms. (D) Plot of ΔCm over QCa. All data points from experiments with 0.5 and 10 mM EGTA were treated as one group and fit with a single exponential equation (red curve) to estimate the size of the RRP (ΔCm amplitude) and the amount of QCa needed to release 63% (~1/e) of the RRP. (E) Plot of ΔCm and QCa values produced with 0.5 and 1 ms steps. * indicates a significant difference for QCa between 0.5 mM versus 10 mM EGTA; p: 0.04, and 6 and 9 cells, respectively. (F) Plot of ΔCm over peak-ICa for step durations: 0.5–30 ms (dashed lines partition data points by step duration). * indicates a significant difference in ICathat is described in (C), and differences in ΔCm are described in Figure 5C. RRP, readily releasable pool.

