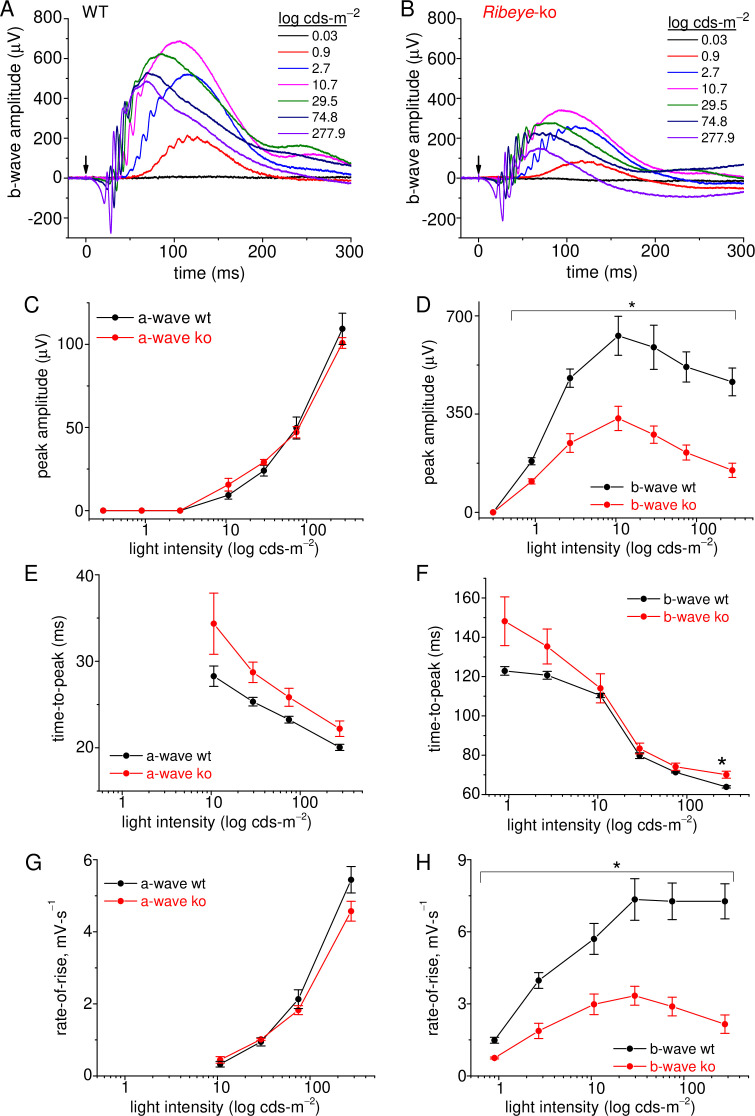
Figure 8. Rod-driven light responses are depressed in Ribeye-ko mice.
(A) Scotopic-ergs recorded from a dark-adapted wt animal. Light flash intensities are indicated in the graph. The arrow marks the moment of the 0.1 ms light flash. Responses are presented at full band-width, without offline filtering. (B) Scotopic-ergs recorded from a dark-adapted Ribeye-ko animal. (C) Summary of erg a-wave amplitudes plotted over the range of light flash intensities shows no significant difference between wt and ko mice. (D) Summary of dark-adapted erg b-waves measured from wt and ko mice shows a significant difference in responses at all flash intensities (*, p<0.04), except at the weakest intensity tested. (E) The a-wave time-to-peak values were not significantly different when comparing genotypes. (F) The b-wave time-to-peak values were similar, except the ko responses were significantly slower at the highest flash intensity (*, p: 0.034). (G) The a-wave rate-of-rise values were not significantly different. (H) The b-wave rate-of-rise was significantly faster for wt than ko mice across the full range of flash intensities (*; p-values: 0.04–0.009). Average values and statistical comparisons presented in C–H were derived from 4 ko and 3 wt mice.

