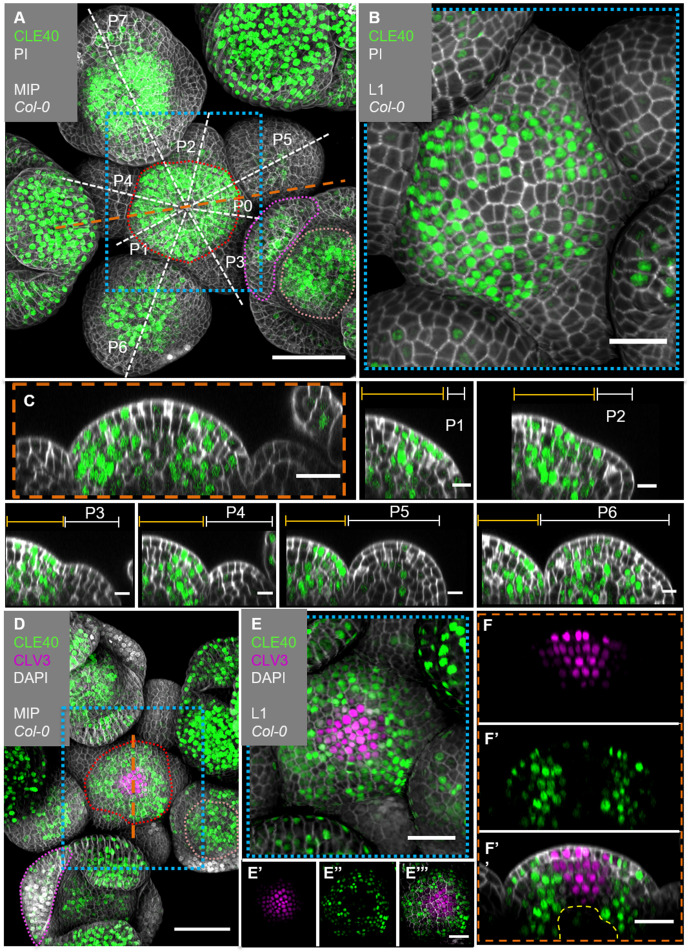
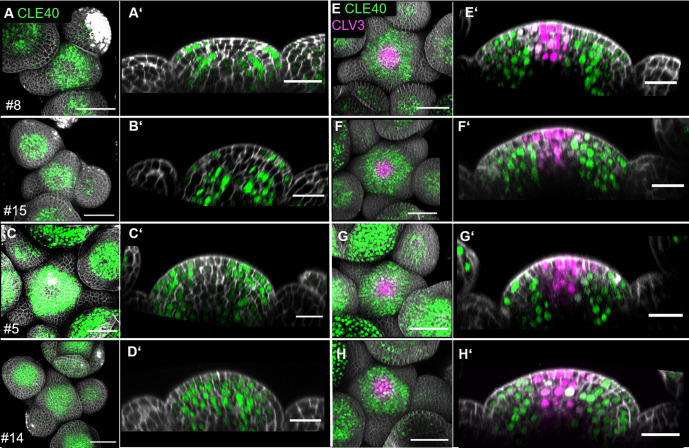
Figure 2. CLE40 and CLV3 show complementary expression patterns in the inflorescence meristem (IFM).
(A) Maximum intensity projection (MIP) of an inflorescence at 5 weeks after germination (WAG) expressing the transcriptional reporter CLE40:Venus-H2B//Col-0 showing CLE40 expression in the IFM, older primordia and sepals (N = 23). (B) The L1 projection shows high expression in the epidermis of the periphery of the IFM and only weak expression in the central zone (CZ). (C) Longitudinal section through the IFM shows expression of CLE40 in the periphery, but downregulated expression in the CZ. (P1 –P6) Longitudinal section through primordia show no CLE40 expression in young primordia (P1–P4), but in the centre of older primordia (P5–P6). (D) The MIP of the double reporter line of CLE40 and CLV3 (CLE40:Venus-H2B;CLV3:NLS-3xmCherry//Col-0) shows CLV3 expression in the CZ surrounded by CLE40 expression in the periphery (N = 12). (E–E’’’) The L1 projection shows CLV3 (E’) expression in the centre of the IFM and CLE40 (E’’) expression in a distinct complementary pattern in the periphery of the IFM. (F) The longitudinal section through the centre of the IFM shows CLV3 expression in the CZ while CLE40 (F’) is mostly expressed in the surrounding cells. (F’’) CLE40 and CLV3 are expressed in complementary patterns. Dashed blue lines indicate magnified areas, dashed white and orange lines indicate planes of longitudinal sections, dashed red line in (A) and (D) marks the IFM area, the dashed pink line marks the sepals, the dashed rose line marks the FMs and dashed yellow line in (F’’) the OC. Scale bars: 50 µm (A, D), 20 µm (B, C, E, E’’’, F’’), 10 µm (P0–P6), PI: propidium iodide; L1: visualization of layer 1 only; P1–P7: primordia at consecutive stages.


