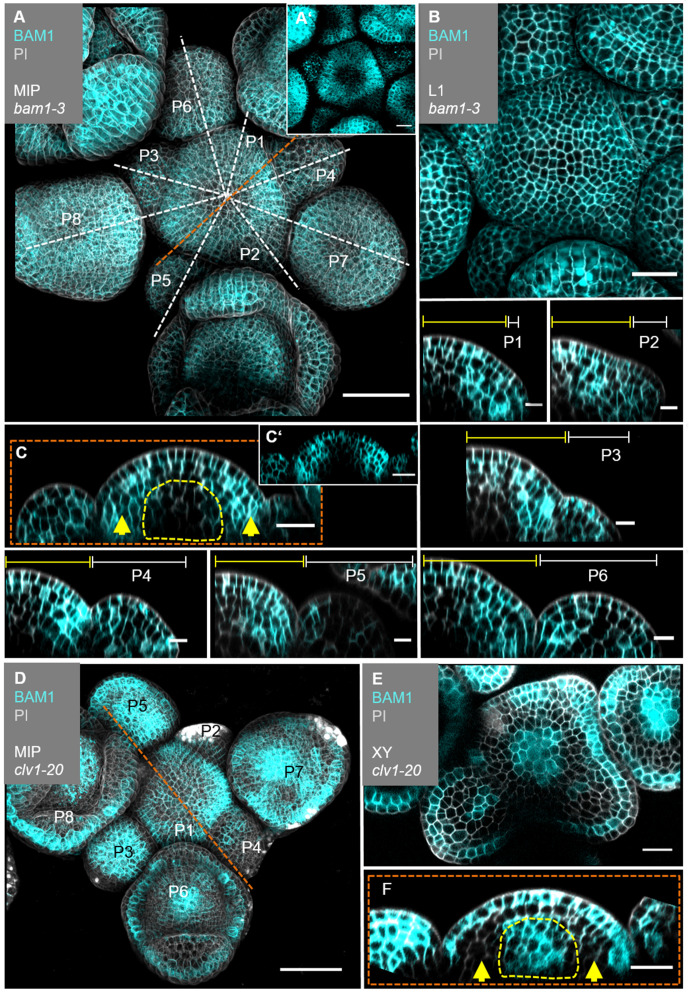
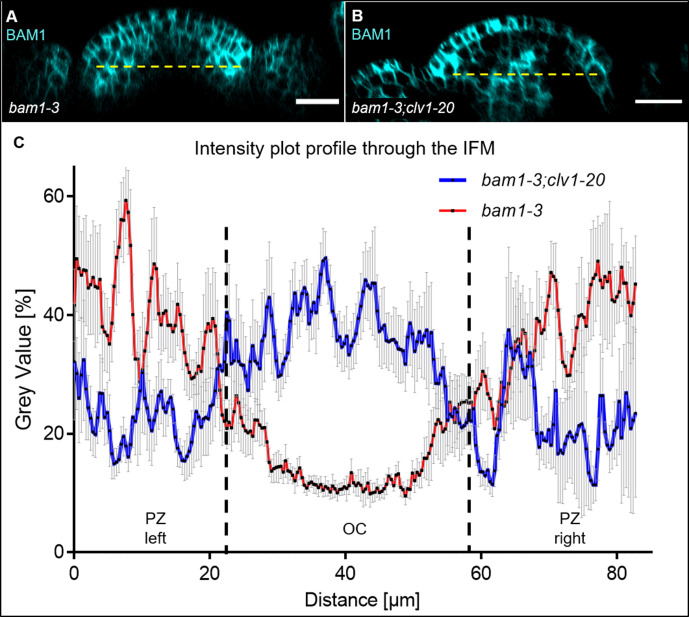
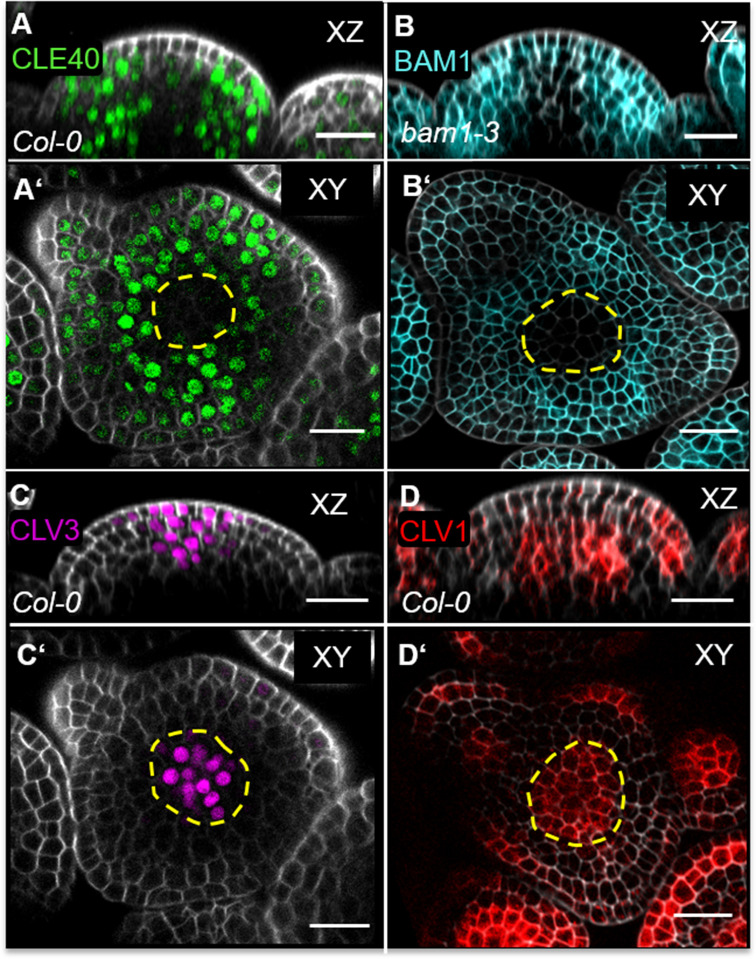
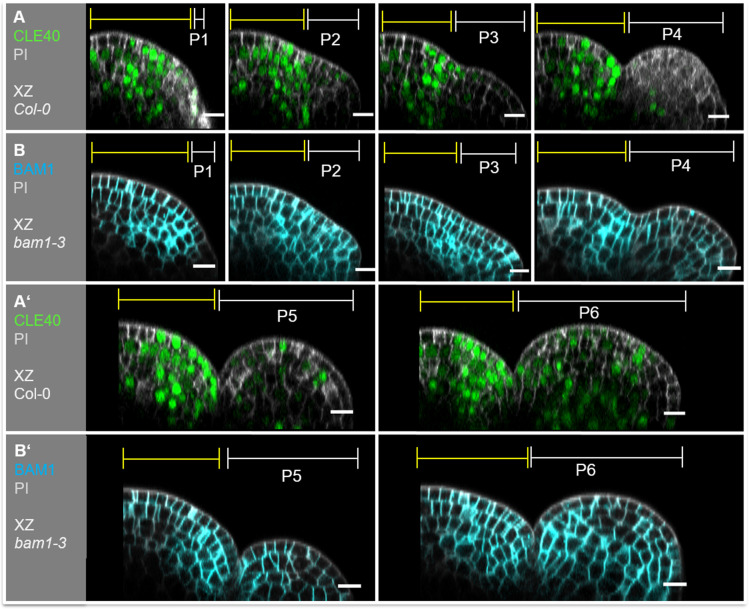
Figure 5. BAM1 expression is elevated in the flanks of the inflorescence meristem (IFM) and not detectable in the organizing centre (OC).
(A) Maximum intensity projection (MIP) of BAM1 under its endogenous promoter (BAM1:BAM1-GFP//bam1-3) at 5 weeks after germination (WAG). BAM1 expression is detected nearly throughout the entire inflorescence (IFM, flower meristem [FM], sepals) with weak expression in the central zone (CZ) of IFM and FMs (N = 15). (A’) MIP of the IFM from (A) without propidium iodide (PI) staining. (B) The layer 1 (L1) projection of the IFM shows ubiquitous expression of BAM1. (C) Longitudinal optical section through the IFM shows elevated BAM1 expression in the flanks (yellow arrows) and a lack of BAM1 expression in the OC. (C’) XZ section from (C) without PI staining. (P1–P6) BAM1 expression is found in all primordia cells. (D) MIP of BAM1 in a clv1-20 mutant (BAM1:BAM1-GFP//bam1-3;clv1-20). BAM1 expression is detected in most parts of the inflorescence, especially in the centre of the IFM and FMs (N = 9). (E) Cross-section (XY) of the IFM (from D) shows BAM1 expression in a clv1-20 mutant in the CZ (IFM and FMs) and the L1/L2. (F) Longitudinal optical section through the meristem (from D) shows BAM1 expression in the OC and the L1, while no BAM1 expression is detected in the peripheral zone (PZ) (yellow arrows). Dashed white and orange lines indicate longitudinal sections; dashed yellow lines in (C) and (F) mark the OC area, yellow lines (P1–P6) indicate the IFM region, white lines (P1–P6) mark the primordium and yellow arrows indicate high (C) or no (F) BAM1 expression in the PZ. Scale bars: 50 µm (A, D), 20 µm (B, C, E, F), 10 µm (P1–P6). P: primordium.

