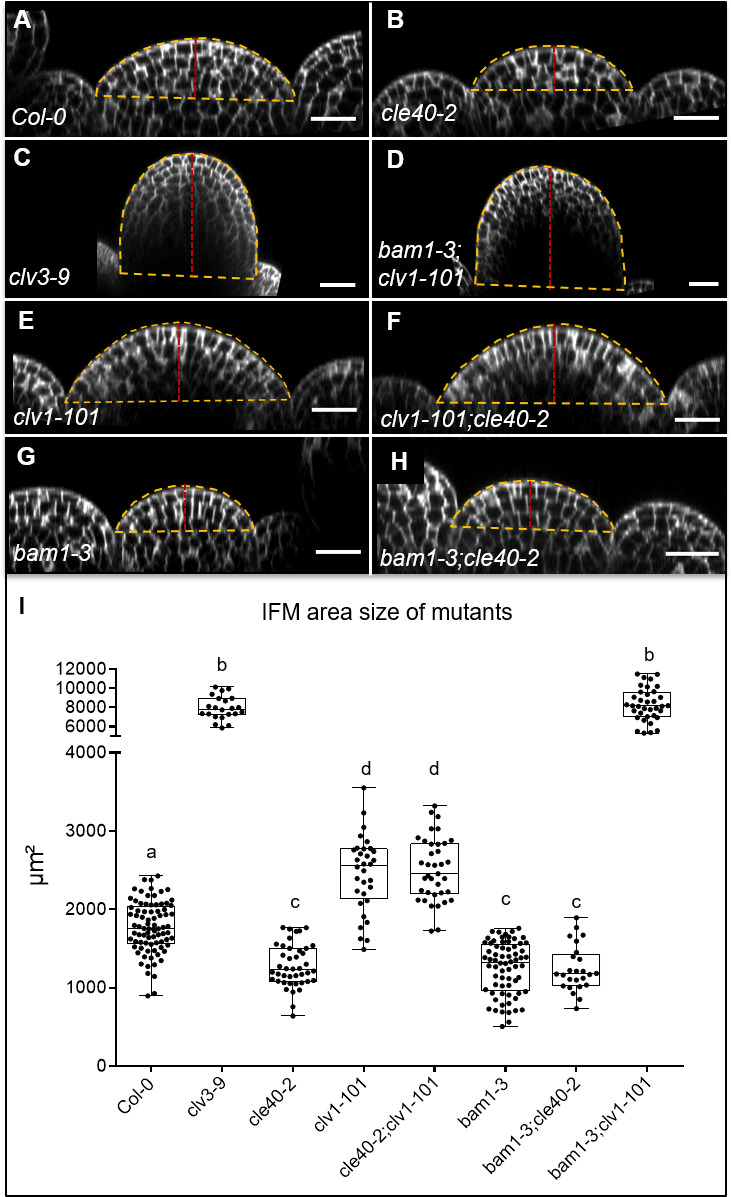
Figure 6. Inflorescence meristem (IFM) size of single and double mutants.
XZ sections through the centre of IFMs of (A) Col-0, (B) cle40-2, (C) clv3-9, (D) bam1-3;clv1-101, (E) clv1-101, (F) clv1-101;cle40-2, (G) bam1-3 and (H) bam1-3;cle40-2 plants. (I) Box and whisker plot of the IFM area size of Col-0 (N = 82), various single (clv3-9 [N = 22], cle40-2 [N = 42], clv1-101 [N = 32], bam1-3 [N = 68]) and double mutants (cle40-2;clv1-101 [N = 37], cle40-2;bam1-3 [N = 25] and bam1-3;clv1-101 [N = 36]) at 6 weeks after germination (WAG).The yellow dashed line depicts the area of the meristem that was measured, and the dashed red line indicates the height of the meristems. Scale bar: 20 µm (A–H). Statistical groups were assigned after calculating p-values by ANOVA and Tukey’s multiple comparison test (differential grouping from p≤0.01).


