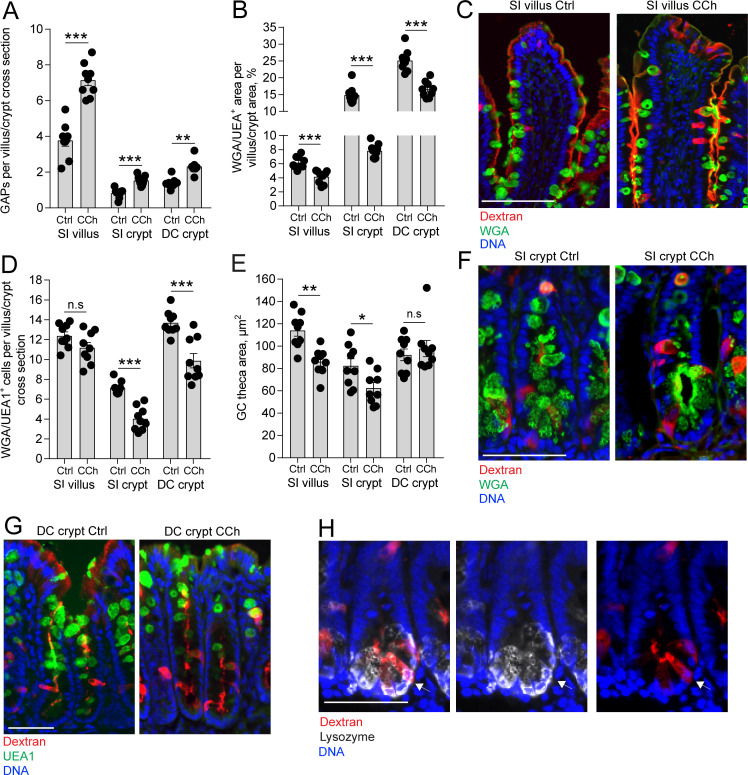
Figure 4. Carbamylcholine (CCh)-induced goblet cell (GC)-associated antigen passage (GAP) formation and mucus secretion in the small intestine (SI) and distal colon.
(A) GAP numbers, (B) total wheat germ agglutinin-positive (WGA+) (SI) or Ulex europaeus agglutinin 1 (UEA1+) (distal colon) mucus area per villus/crypt area, (C) representative wide-field fluorescent image of SI villus, (D) quantification of the number of WGA+ (SI) or UEA1+ (distal colon) GCs per villus or crypt cross section, (E) quantification of GC theca area, (F) representative wide-field fluorescent image of SI crypts in vehicle and CCh treated tissue. (G) Representative wide-field fluorescent image of distal colon crypts and (H) representative wide-field fluorescent image of an SI crypt following intraluminal tetramethylrodamine (TRITC)-dextran (red) administration stained for Lysozyme (white). Arrows denote a Paneth cell containing TRITC-dextran. Scale bar: (C) 100 µm, (F, J, K) 50 µm. Data are presented as mean ± SEM, *p < 0.05, **p < 0.01, ***p < 0.001, n.s = non-significant, n = 9 in all groups. Statistical analysis was performed using an unpaired two-sided Student’s t-test. Each data point in A–B, D–E represents the average of 25 villi or 40 crypts from one mouse.

