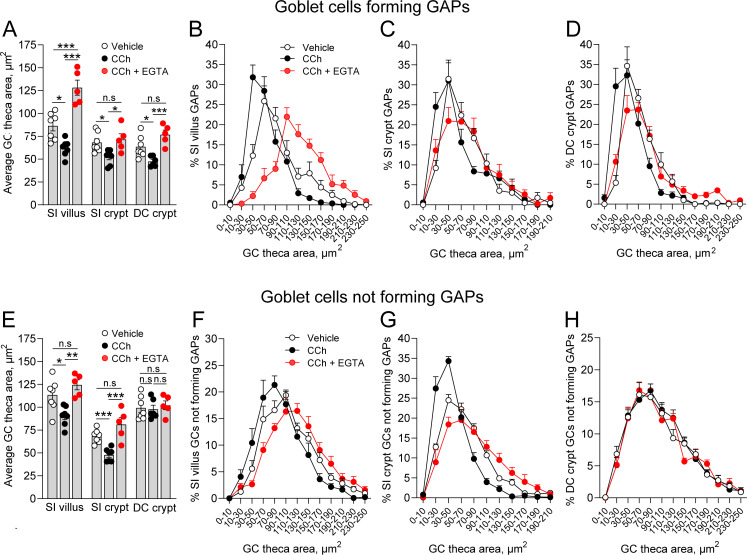
Figure 8. Carbamylcholine (CCh) induced mucus secretion and goblet cell (GC)-associated antigen passage (GAP) formation can occur in parallel within the same GC.
(A) Average theca area of GCs forming GAPs in vehicle, CCh, and CCh + EGTA treated mice. Size distribution of the theca area of GCs forming GAPs in vehicle, CCh, and CCh + EGTA treated mice in (B) small intestine (SI) villus, (C) SI crypt, and (D) DC crypt. (E) Average theca area of GCs not forming GAPs in vehicle, CCh, and CCh + EGTA treated mice. Size distribution of GCs not forming GAPs in vehicle, CCh, and CCh + EGTA treated mice in (F) SI villus, (G) SI crypt, and (H) DC crypt. Data are presented as mean ± SEM. Vehicle n = 7, CCh n = 7, CCh + EGTA n = 5. Statistical analysis was performed using a one-way ANOVA with Tukey’s post hoc test for multiple comparisons. In panels B–D and F–H, the data represent the percentage of GCs within the respective area bins as part of the total population of GCs forming GAPs, or the total population of GCs not forming GAPs (100%).

