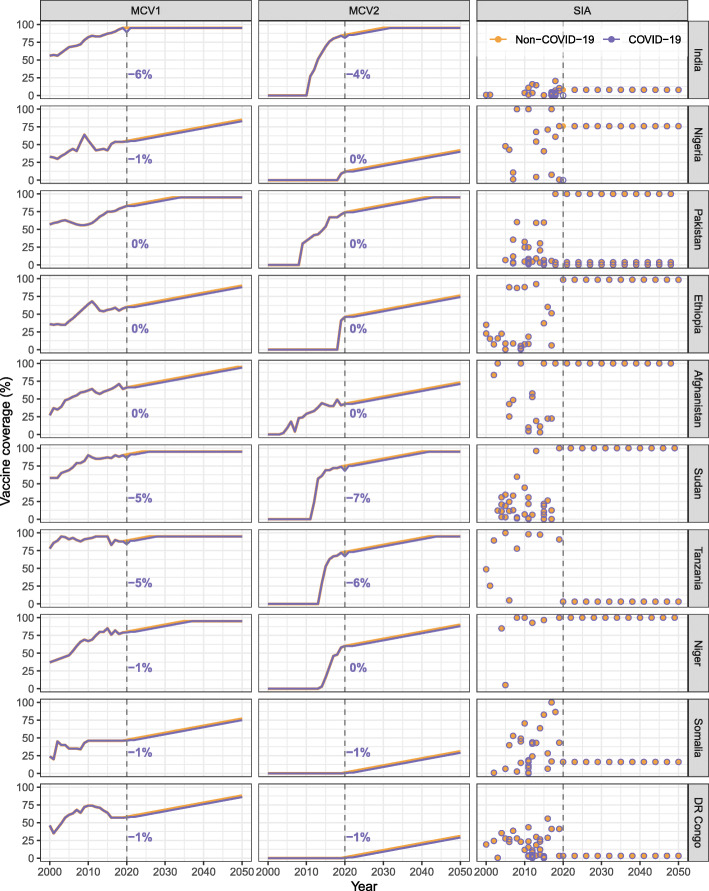
Fig. 2.
Measles vaccine coverage by dose and country, 2000–2050. Historical coverage data by dose and country were obtained from the WHO databases, while future trends were assumed to increase by 1% every year for the first (MCV1) and second (MCV2) doses delivered through routine programmes. Supplementary immunisation activities (SIAs) were assumed to occur every 3 years in the future projection, with the coverage seen in the most recent year. Multiple rounds of SIAs may happen within a single year in a country. Colours of lines and circles represent different assumptions on the effect of COVID-19 related disruptions. Vertical dashed lines mark the year 2000 and the numbers next to the lines show the absolute difference in MCV1 and MCV2 coverage estimates in the COVID-19 scenario compared to the baseline

