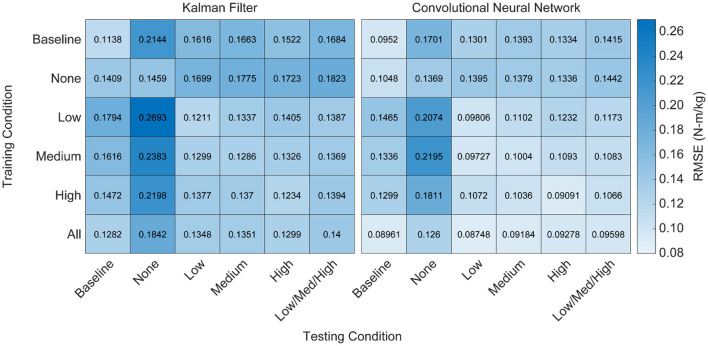
Figure 5.
Heatmap of algorithm performance under various training and testing conditions. Performance is shown as RMSE (N-m/kg) of algorithm predictions relative to the ground truth values of right and left hip torque in the sagittal plane. Lighter colors represent lower RMSE and better performance. Training and testing on the same condition led to strong performance for both algorithms, as indicated by low RMSE values along the diagonals. Testing on conditions that were not explicitly trained on resulted in worse performance, as indicated by high RMSE values off the diagonals. Training on all of the conditions improved the overall performance of the CNN when testing on various levels of exoskeleton assistance, but did not improve the overall performance of the KF. That is, diverse training data increased the adaptability of the CNN, but not the KF.

