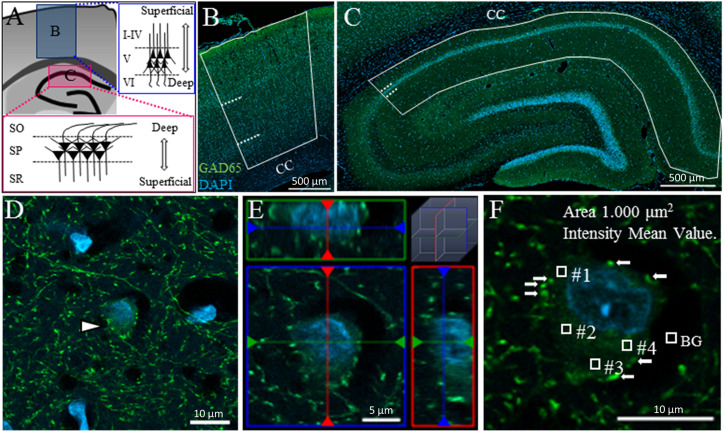
FIGURE 1.
Measuring GAD65 staining intensity in somata in the cerebral cortex and hippocampus. Schematic drawing of a coronal section of an adult rat brain showing the cerebral cortex (A: upper inset B) and hippocampus (A: lower inset C). The cerebral cortex and hippocampus were each divided into three layers. Solid lines and dashed lines indicate the region of interest and the boundaries between layers, respectively, in the cerebral cortex (B) and hippocampus (C). The area of GAD65 expression in the soma was surrounded by synaptic buttons in the 2D (D: arrowhead) and 3D images (E: ortho-image from the x, y, and z planes). The level of GAD65 expression was calculated by subtracting the background (BG) intensity from the average intensity of four squares (F). CC, corpus callosum.

