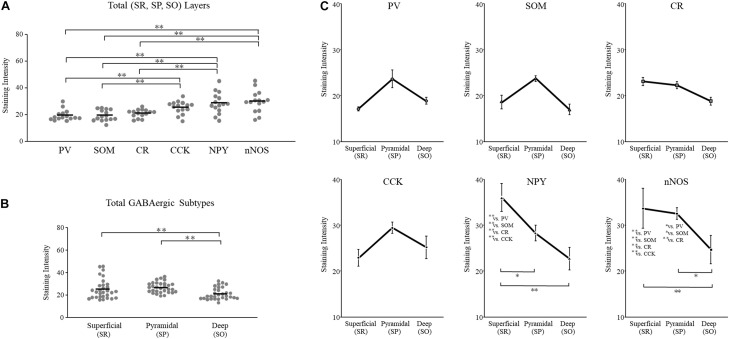
FIGURE 5.
GAD65 expression in each GABAergic subtype across layers of the hippocampus (n = 5 brains). The average intensity of GAD65 immunostaining among six GABAergic subtypes (A). The average intensity of GAD65 immunostaining among the superficial (SR), pyramidal (SP), and deep (SO) layers (B). The average intensity of GAD65 immunostaining across layers of the cerebral cortex among six GABAergic subtypes (C). SO, stratum oriens; SP, stratum pyramidale; and SR, stratum radiatum. Error bars indicate SEM. Two-way ANOVA followed by Bonferroni’s tests was used to compare the expression level. ∗p < 0.05. ∗∗p < 0.01.

