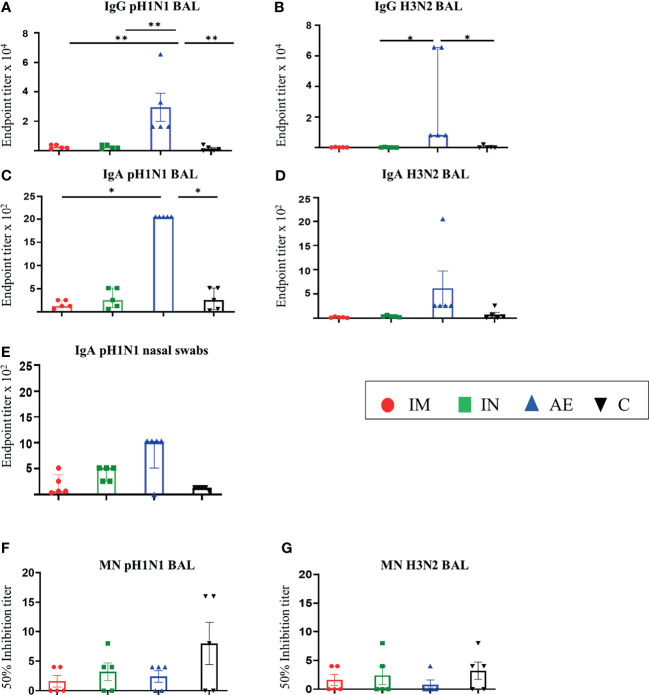
Figure 2.
Mucosal antibody responses. (A–D) pH1N1- and H3N2-specific IgG and IgA responses in BAL and (E) pH1N1-specific IgA responses in nasal swabs were determined by ELISA 4 weeks after immunization. (F, G) BAL-neutralizing titers were determined by microneutralization (MN) of (F) pH1N1 and (G) H3N2 4 weeks after immunization. For graphs (B, C, E), Kruskal–Wallis and Dunn’s multiple comparisons tests were performed, and the top of these bars indicates the median and the line the interquartile range. The rest of the graphs were analyzed by one-way ANOVA and Bonferroni’s multiple comparisons test, and the top of each bar indicates the mean and the line the standard error mean (SEM). Each symbol (circle, square, and triangles) represents one animal. Asterisks denote significance between indicated groups (*p < 0.05 and **p < 0.01).

