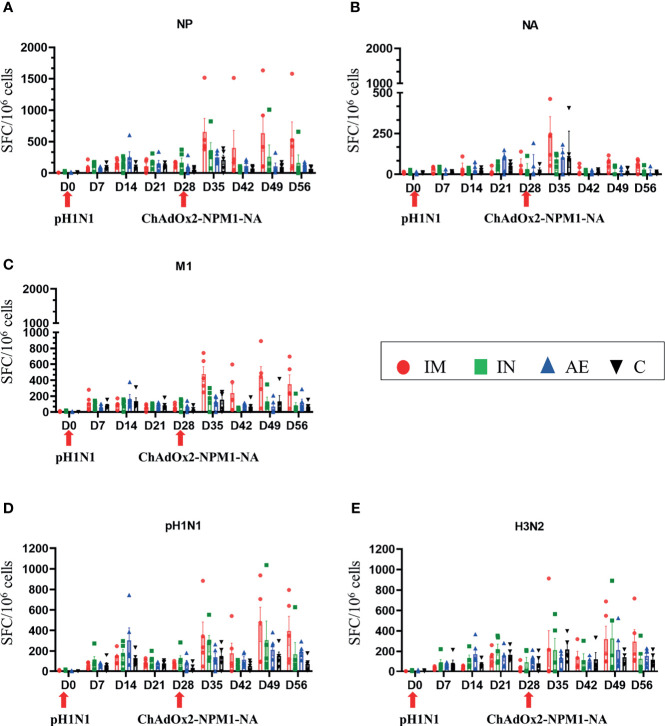
Figure 3.
IFNγ ELISpot responses in PBMC. IFNγ secreting spot-forming cells (SFC) were enumerated during the time course following stimulation with a pool of peptides covering (A) NP, (B) M1, and (C) NA proteins or (D) pH1N1 and (E) H3N2 viruses. The arrows below D0 and D28 indicate the challenge of the pigs with pH1N1 and the immunization with ChAdOx2-NPM1-NA, respectively. The C group was not immunized. Each symbol represents an individual animal, the top of the bar represents the mean, and the line the standard error (SEM) except for graph (B), where the top of the bar indicates the median and the line the interquartile range. Significant statistical differences are listed in Table 2, 3. .

