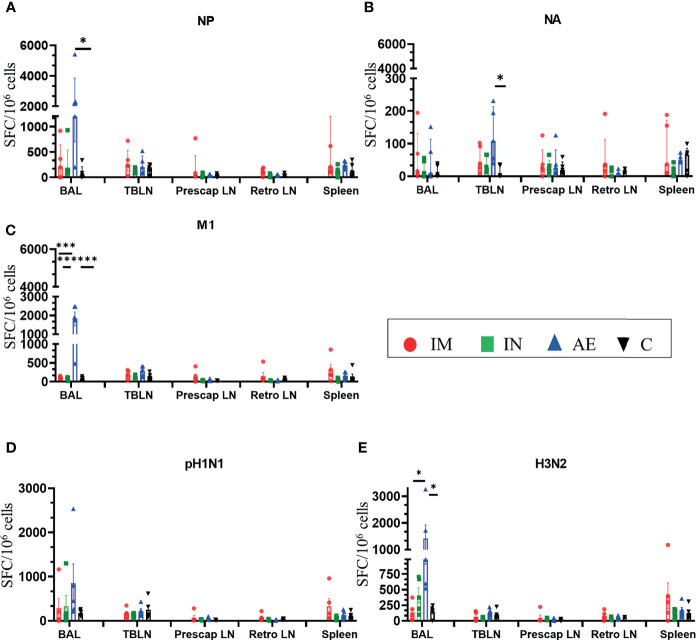
Figure 4.
IFNγ ELISpot responses in tissues. IFNγ secreting spot-forming cells (SFC) were enumerated in BAL, tracheobronchial lymph nodes (TBLN), prescapular lymph nodes (prescap LN), retropharyngeal lymph nodes (retro LN), and spleen on D56. Cells from tissues were stimulated with a pool of peptides covering (A) NP, (B) M1, and (C) NA proteins or (D) pH1N1 and (E) H3N2 viruses. Each symbol represents an individual animal. For graphs (A) and (B), Kruskal–Wallis and Dunn’s multiple comparisons tests were performed, and the top of these bars indicates the median and the line the interquartile range. The rest of the graphs were analyzed by one-way ANOVA and Bonferroni’s multiple comparisons test, and the top of the bar indicates the mean and the line the standard error (SEM). Asterisks denote significance between indicated groups (*p < 0.05, ***p < 0.001).

