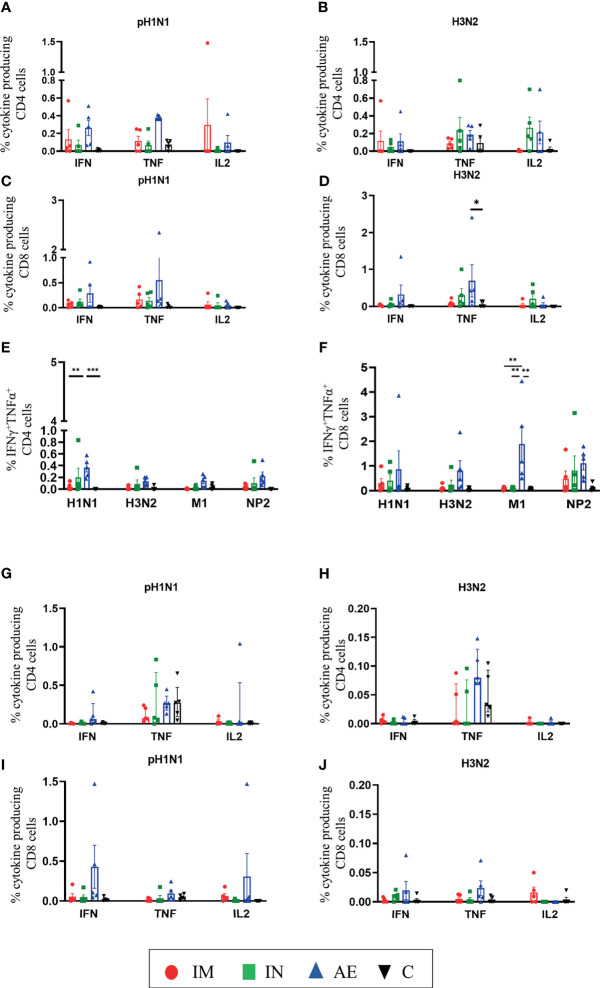
Figure 5.
T-cell cytokine responses in BAL and TBLN. (A–F) BAL and (G–J) TBLN were collected 4 weeks post-immunization. Cryopreserved cells were thawed and stimulated with (A, C, G, I) pH1N1 or (B, D, H, J) H3N2, and IFNγ, IL-2, TNF, and IFNγTNF cytokine secretions were measured in CD4 and CD8 T cells by intracellular cytokine staining. IFNγTNF co-production within (E) CD4 and (F) CD8 T cells in BAL was determined following pH1N1, H3N2, or M1 and NP2 protein stimulation. Each symbol represents an individual animal. For graphs (G) and (H), Kruskal–Wallis and Dunn’s multiple comparisons tests were performed, and the top of these bars indicates the median and the line the interquartile range. The rest of the graphs were analyzed by two-way ANOVA and Bonferroni’s multiple comparisons test, and the top of these bars indicates the mean and the line the standard error (SEM). Asterisks indicate significant differences (*p < 0.05, **p < 0.01, ***p < 0.001).

