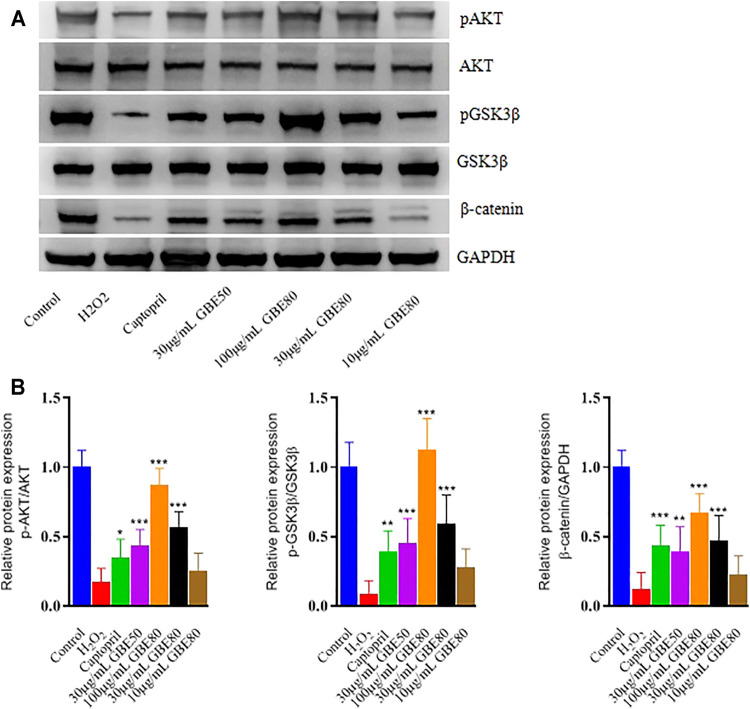
FIGURE 2.
Effects of different treatments under H2O2 injury on the levels of pAKT, AKT, pGSK3β, GSK3β, and β-catenin. Western blotting (A) and densitometry analysis (B) of pAKT, pGSK3β, and GAPDH in cardiomyocytes treated with H2O2 and different treatment. (*, **, *** indicates p < 0.05, p < 0.01, p < 0.001 vs the H2O2 group, respectively.)

