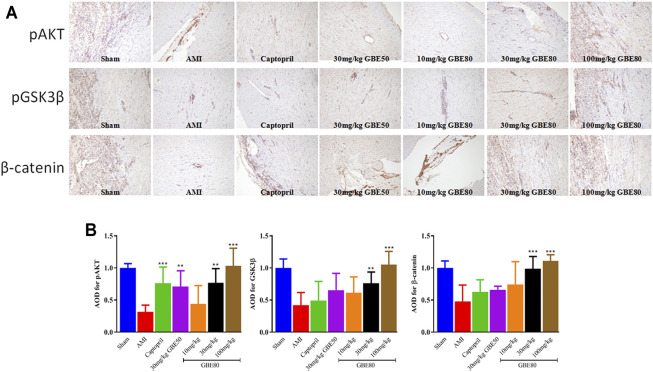
FIGURE 5.
Expressions of pAKT, pGSK3β and β-catenin in the left ventricle detected by immunohistochemical staining. (A) Representative immunohistochemical staining obtained from left ventricles of several groups with pAKT, pGSK3β and β-catenin detection (×100). (B) Quantitative statistical analysis of AOD values using Image-Pro Plus software. (**, *** indicates p < 0.01, p < 0.001 vs the AMI group, respectively).

