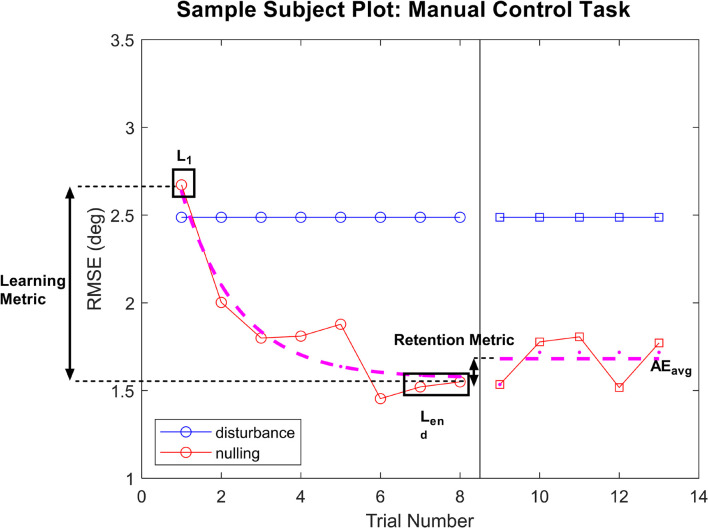
FIGURE 2.
Sample plot of performance for a subject in the manual control task. For both tasks, performance on each trial was plotted for the learning phase and the aftereffects phase. An exponential decay was fit to the learning phase, with L1 and Lend values pulled from the model fits with R2 > 0.45. For subject whose learning was not well captured by the model fit (R2 < 0.45), raw performance on trials 1 or the average of trials 7 and 8 were used for L1 and Lend, respectively. Average performance across the aftereffects phase was used as AEavg in calculating the retention metric.

