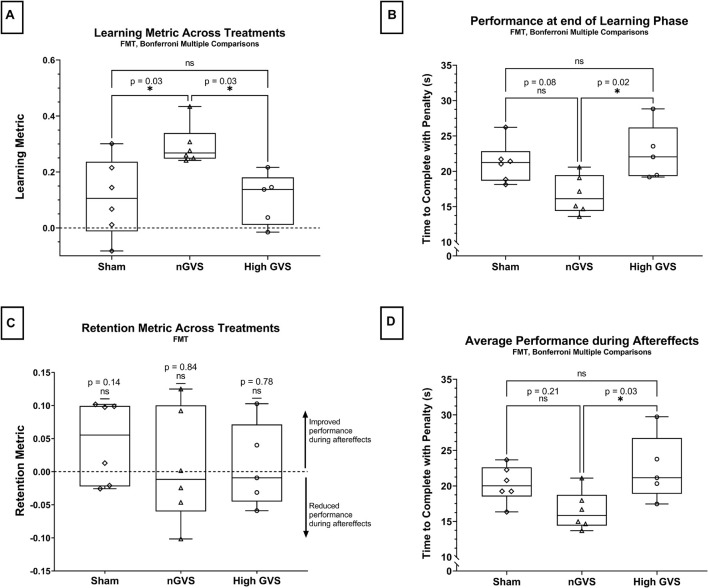
FIGURE 3.
FMT data analysis. The symbol * denotes significant comparisons at α = 0.05. (A) Comparison of learning metric across treatments. (B) Comparison of time to complete the course (with penalties) at the end of the learning phase (Lend) across treatments. (C) Comparison of retention metric across treatments shows no significant change in performance between end of learning phase and average performance during aftereffects for any treatment. (D) Average time to complete the course (with penalties) during aftereffects (AEavg) across treatment groups.

