
Figure 5.
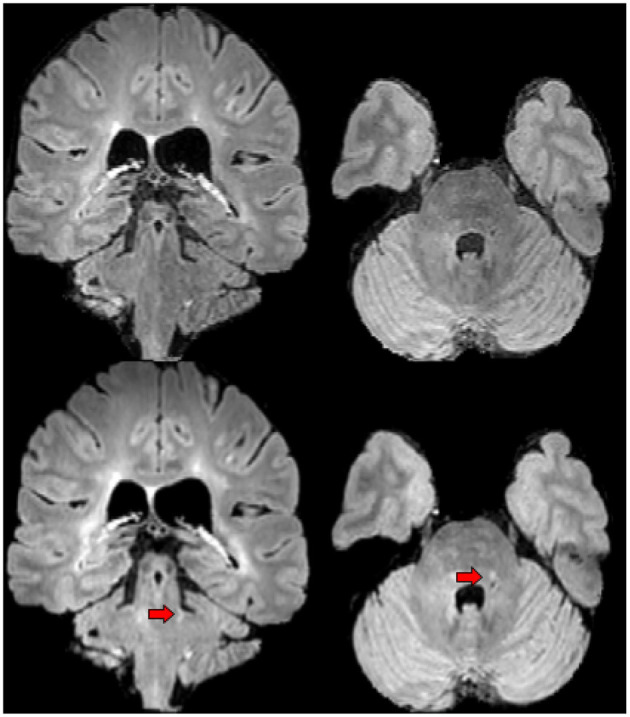
An example of lesion detected by expert 1 in the first phase of the experiment but not by experts 2 and 3. First row shows the baseline FLAIR scan (from left-to-right: coronal and axial view), second row shows the FLAIR scan 1 year later (from left-to-right: coronal and axial view). Red arrows designate the lesion of interest.