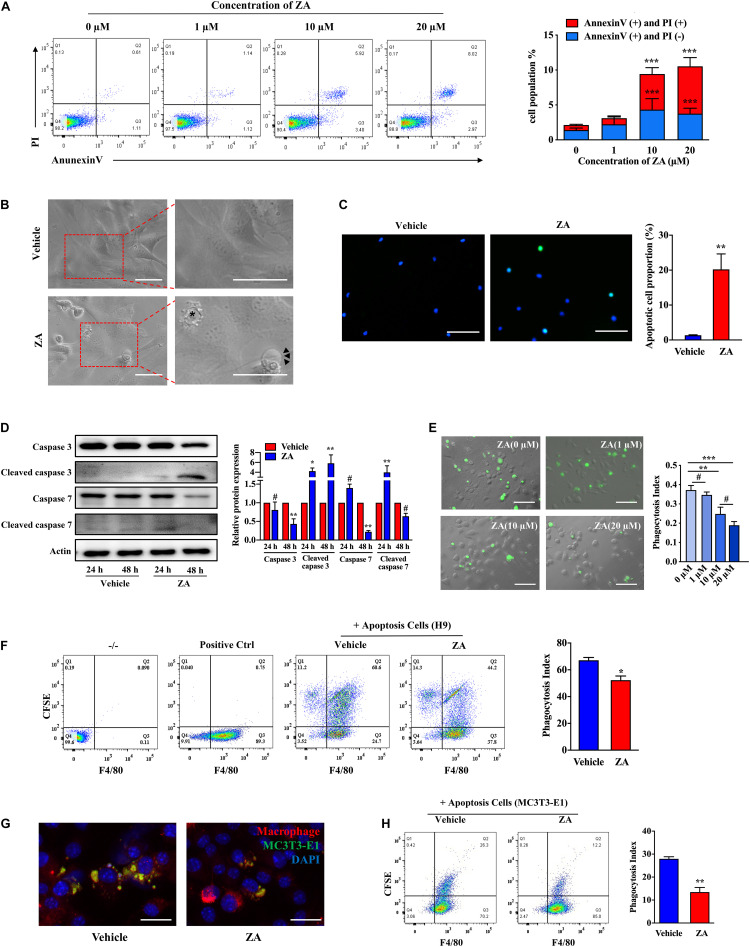
FIGURE 1.
ZA promotes the MC3T3-E1 apoptosis and impairs the efferocytosis of macrophages in vitro. (A) MC3T3-E1 were treated with ZA of various concentrations for 24 h. Cells were stained with Annexin V and PI and then subjected to flow cytometry. (B) Bright-field images of MC3T3-E1 treated with ZA. Apoptotic cells are indicated by an asterisk. Features include plasma membrane blebbing. Cells experiencing secondary necrosis are marked with arrows, characteristic of plasma membrane extrusions. Scale bar, 50 μm. (C) TUNEL images of MC3T3-E1 treated with ZA. Scale bar, 100 μM. (D) Protein expression of total caspase 3, cleaved caspase 3, total caspase 7, and cleaved caspase 7 in MC3T3-E1 treated with ZA for 24 or 48 h. (E) Representative macroscopic imaging of macrophage efferocytosis. CFSE-labeled H9 cells and the ZA-treated BMDMs were cocultured for 1 h. Relative efferocytosis index is shown and was calculated as the ratio of macrophages that have phagocytosed apoptotic H9 to the total number of macrophages. Scale bar, 100 μm. (F) Flow cytometry analysis of macrophage phagocytosis of CFSE-labeled apoptotic H9 cells. Representative plot shows cells double positive for CFSE and the macrophage marker F4/80 indicating efferocytosis. (G) Representative images of BMDMs (F4/80, red) ingested apoptotic MC3T3-E1 (CFSE, green) for 2 h. BMDMs were stimulated with vehicle or ZA (10 μM) for 24 h before addition of CFSE-labeled apoptotic MC3T3-E1. Scale bar, 50 μm. (H) Flow cytometry analysis of macrophage phagocytosis of CFSE-labeled apoptotic MC3T3-E1 cells. Representative plot shows cells double positive for CFSE and the macrophage marker F4/80 indicating efferocytosis. The data are presented as the mean ± SEM values (n = 3). *p < 0.05, **p < 0.01, ***p < 0.001, #p > 0.05. ZA, zoledronic acid; PI, propidium iodide; CFSE, carboxyfluorescein succinimidyl ester; BMDMs, bone marrow-derived macrophages.

