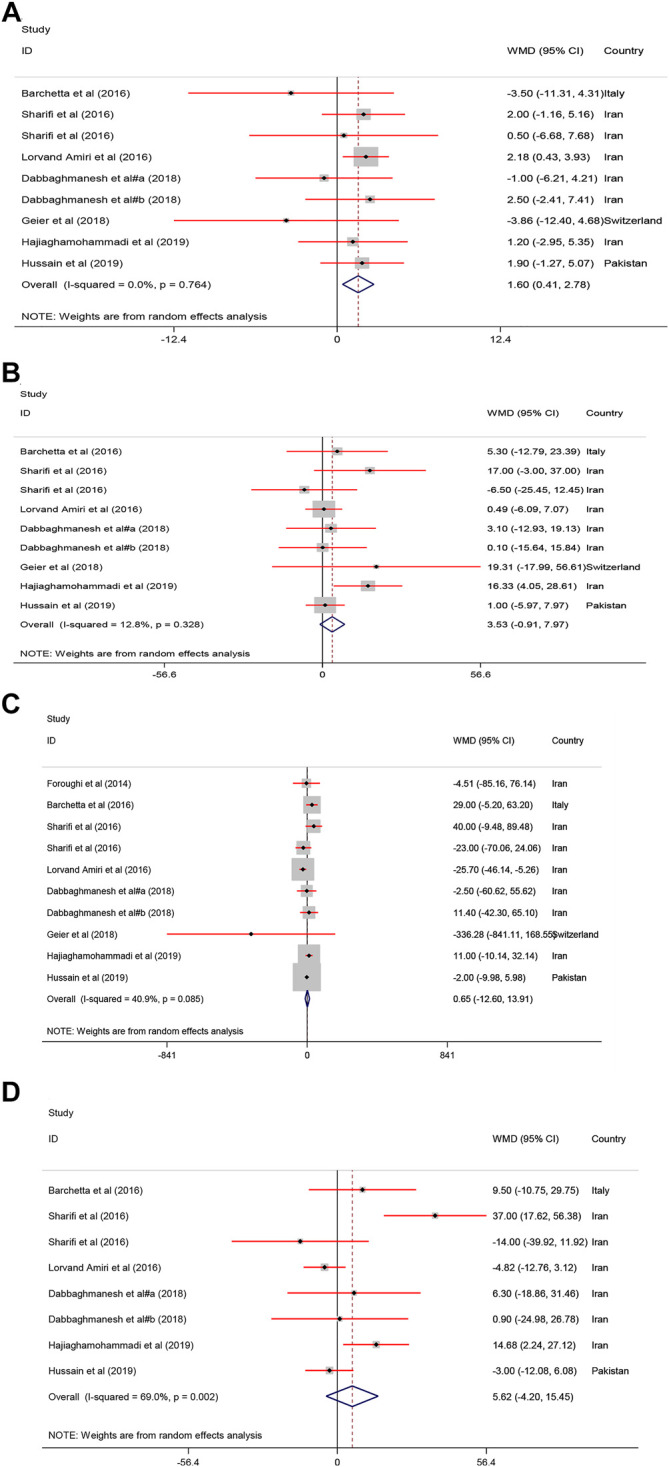
FIGURE 2.

The lipid profile standardized mean differences estimates for (A) HDL−C, (B) LDL−C, (C) TG and (D) TC between intervention group (receiving vitamin D supplementation) and placebo groups.

The lipid profile standardized mean differences estimates for (A) HDL−C, (B) LDL−C, (C) TG and (D) TC between intervention group (receiving vitamin D supplementation) and placebo groups.