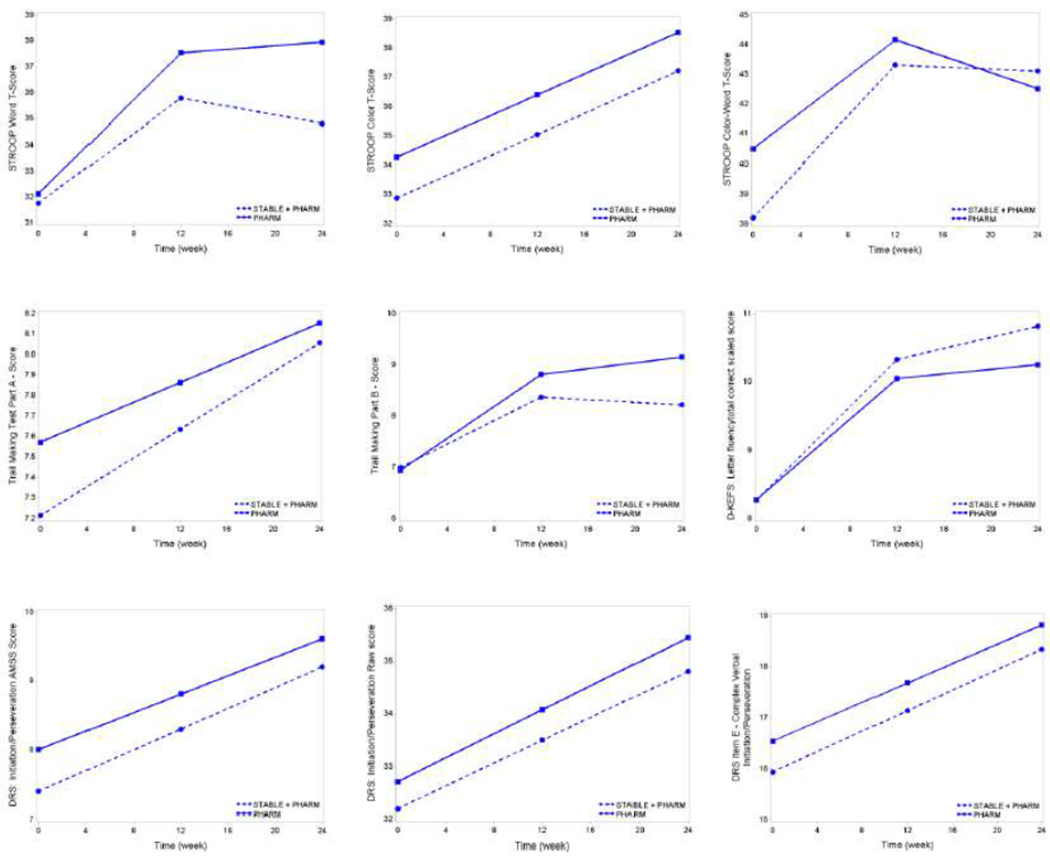
Figure 2.

Trajectories of Executive Function Neurocognitive Outcomes over the 6- month Study Period By Treatment Arm Using Model-Derived Adjusted Treatment Means
Stroop - selective and divided attention and cognitive flexibility:
These graphs show adjusted least squares means from quadratic (STROOP Word T-score & STROOP Color-Word T-score) and linear (STROOP Color T-score) mixed effects models with random intercept using unstructured covariance adjusted for site, psychosis, age, Wechsler Test of Adult Reading and Ham-D (time varying). Except for Color-Word T-Score Medication only treatment group, the within group improvement from baseline was statistically significant at p≤0.05 (Measure, p-value [DF, t-statistic]: Word T-Score Stable: 0.0361 [162, 2.11], Pharm: 0.0010 [165, 3.36]; Color T-Score Stable: 0.0076 [164, 2.70], Pharm: 0.0142 [167, 2.48]; Color-Word T-Score Stable: 0.0004 [151, 3.60]).
Trail Making Test Parts A and B:
The graph of Trail Making Test Part A score shows adjusted least squares means from linear mixed effects model with random intercept using unstructured covariance adjusted for site, psychosis, age, Wechsler Test of Adult Reading and Ham-D (time varying). The within group improvement from baseline was not statistically significant in the Medication only treatment group.
The graph of Trail Making Test Part B score shows adjusted least squares means from quadratic mixed effects model with random intercept using unstructured covariance adjusted for site, psychosis, age, Wechsler Test of Adult Reading and Ham-D (time varying). The within group improvement from baseline was statistically significant at p≤0.05 in both treatment arms (Measure, p-value [DF, t-statisticj: TMT Score A Stable: 0.0209 [142, 2.34]; TMT Score B Stable: 0.0242 (142, 2.28), Pharm: 0.0003 [150, 3.72]).
Delis Kaplan Executive Function System (D-KEFS): Letter fluency total correct scaled score:
The graph shows adjusted least squares means from quadratic mixed effects model with random intercept using unstructured covariance adjusted for site, psychosis, age, Wechsler Test of Adult Reading and Ham-D (time varying). The within group improvement from baseline was statistically significant at p≤0.05 in both treatment arms (p [DF, t-statistic] Stable: <0.0001 [169, 4.11], Pharm: 0.0026 [174, 3.05]).
Dementia Rating Scale - IP (DRS-IP):
These graphs show adjusted least squares means from linear mixed effects model with random intercept using unstructured covariance adjusted for site, psychosis, age, Wechsler Test of Adult Reading and Ham-D (time varying). The within group improvement from baseline was statistically significant at p≤0.05 for all DRS items in both treatment groups.
There were no significant differences between the ECT plus Medication and Medication only treatment arms at the post-treatment (24 weeks) time point for all instrument items.
