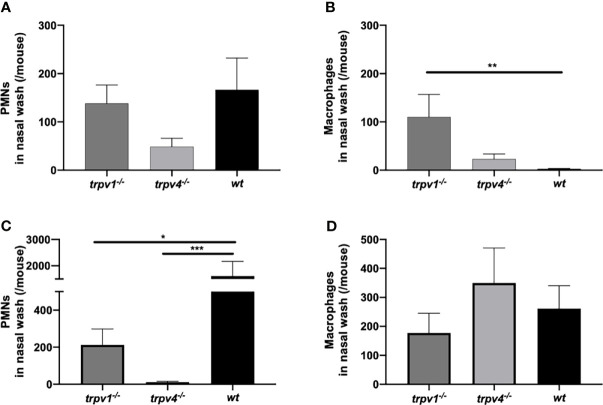
Figure 4.
The number of PMNs and macrophages in the nasal lavages. The nasal lavages were collected on day 2 from the mice in the mono-infection and coinfection model. The numbers of PMNs and macrophages were counted by flow cytometry. (A, B) The mono-infection model and (C, D) the coinfection model. (A, C) the number of PMNs and (B, D) the number of macrophages. The mean value with the standard error of the mean was represented by a line bar. For the mono-infection model (A, B), 15 of TRPV1 KO, 10 of TRPV4 KO, and 10 of wild-type mice were used. For the coinfection model (C, D), 11 of TRPV1 KO, 12 of TRPV4 KO, and 10 of wild-type mice were used. *p < 0.05, **p < 0.01, and ***p < 0.001.

