Figure 6.
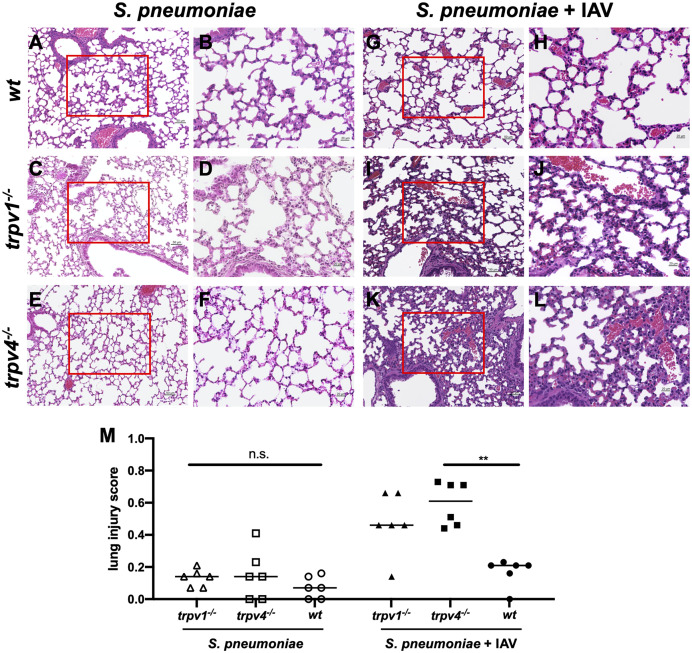
The histology of the lung. The H&E staining of the lung was performed with three mice for each group. The representative images were displayed in this figure. (A–F) The mono-infection model. (G, L) The coinfection model. (A, B, G, H) Wild type (C, D, I, J), TRPV1 KO, and (E, F, K, L) TRPV4 KO. (A, C, E, G, I, K) Low magnification (×200. Scale bar, 50 µm) and (B, D, F, H, J, L) high magnification of boxed sections of the low-magnification field (×400. Scale bar, 20 µm). (M) Lung injury score. The severity of lung inflammation was quantified using the scoring system. Each symbol represents individual data. Horizontal lines indicate median values. (N = 6 for each group). n.s., not significant, **p < 0.01.

