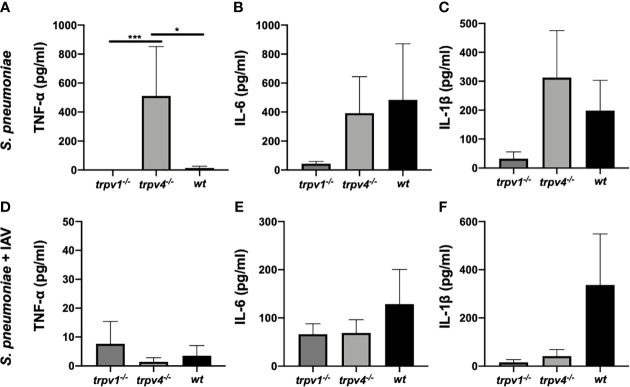
Figure 8.
The levels of cytokines in the sera. The levels of cytokines in the sera were measured on day 2 of the experiment. The data were displayed as mean with standard error of the mean. (A, D) TNF-α, (B, E) IL-6, and (C, F) IL-1β. (A–C) The mono- infection model and (D–F) the coinfection model. For the mono-infection model (A–C), nine of TRPV1 KO, eight of TRPV4 KO, and eight of wild-type mice were used. For the coinfection model (D–F), 13 of TRPV1 KO, 11 of TRPV4 KO, and 8 of wild-type mice were used. *p < 0.05, ***p < 0.001.

