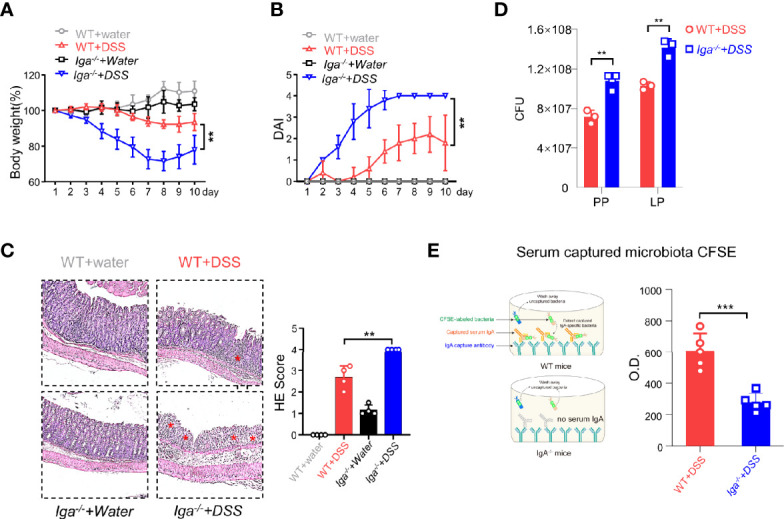
Figure 3.

IgA in DSS-induced colitis. (A) Iga−/− mice and WT mice were administered DSS or regular water (water). Mice were evaluated daily, and weight loss and disease activity index (DAI) scores (B) were recorded. (C) Representative distal colon histological sections of Iga−/− mice were stained with hematoxylin and eosin (H&E), and the histological score was calculated. Images are presented at the original magnification of ×100. Red stars indicate the position of the inflammatory cell infiltration and/or epithelial damage. (D) The colony-forming units (CFU) counts of the bacteria in the feces of WT mice or Iga-/- mice on day 7 of colitis. (E) The O.D. values which indicated bacteria captured by the serum antibodies of WT mice or the Iga-/- mice on day 7 after DSS intervention were measured. **P < 0.01, ***P < 0.001. Data are expressed as mean ± SEM of three mice.
