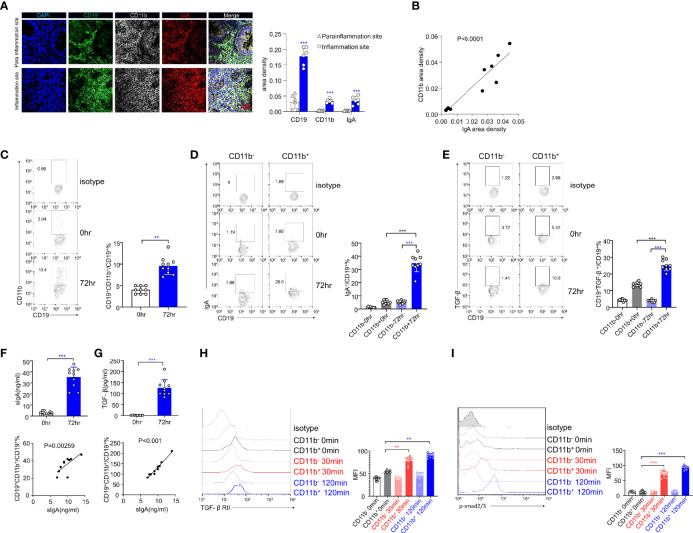
Figure 6.
The expression levels of IgA and TGF-β/Smad pathway are upregulated in human CD11b+ B cells in vitro. (A) Representative staining of CD19 (green), CD11b (white), IgA (red), and 4′, 6-diamidino-2-phenylindole (DAPI) (blue) in the colon tissue of ulcerative colitis (UC) patients. The area density of each marker was calculated. Average data were collected from 20 random fields per patient, n = 6. (B) The relative area density of CD11b and IgA was identified. (C) Total PBMCs were purified and stimulated with CpG-ODN (2 μg/mL) and recombinant human IL-10 for 72 h in vitro. Cells were stained for CD11b detection and analyzed using flow cytometry. (D) The percentage of IgA+ B cells in CD11b+ and CD11b− B cells was analyzed using flow cytometry. (E) The percentage of TGF-β+ B cells in CD11b+ and CD11b− B cells was analyzed using flow cytometry. (F) The culture supernatant was harvested to determine the production of IgA (upper panel) via ELISA. The relative frequencies of CD19+CD11b+ cells and sIgA level were measured (lower panel). (G) The culture supernatant was harvested to determine the production of TGF-β (upper panel) via ELISA. The relative frequencies of CD19+CD11b+ cells and TGF-β level were measured (lower panel). The PBMCs from healthy donors were purified and subsequently stimulated by CpG and TGF-β for 0, 30, and 120 min. Expression of TGF-βRII (H) and the phosphorylation level of Smad2/3 (I) were analyzed using flow cytometry. **P < 0.01; ***P < 0.001. Data represent the mean of more than three independent experiments.

