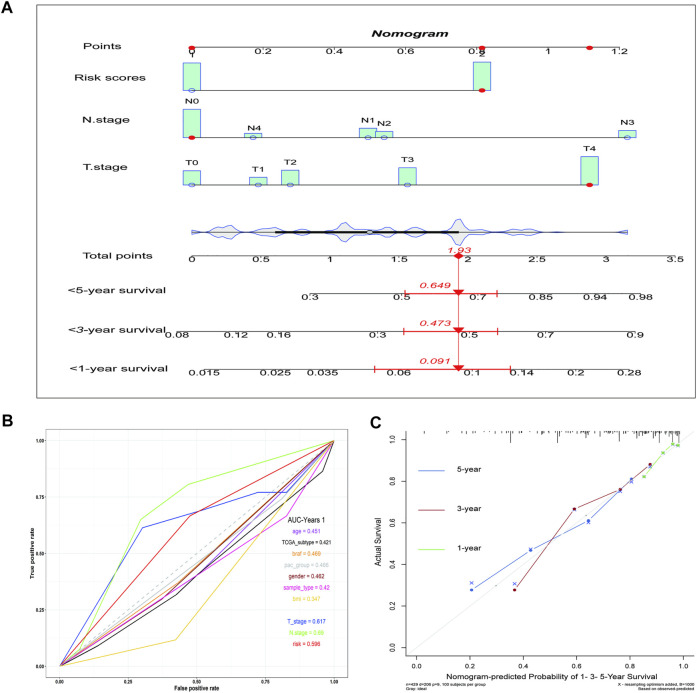
FIGURE 4.
The nomogram shows the impact of various clinical features on survival prognosis in melanoma. (A) A nomogram of the melanoma cohort used to indicate the clinical information and overall survival. (B) ROC curve of clinical features. (C) Calibration maps used to predict the 1, 3, and 5-years survival. The x-axis and y-axis represent the expected and actual survival rates of the nomogram. The solid line represents the predicted nomogram, and the vertical line represents the 95% confidence interval.

