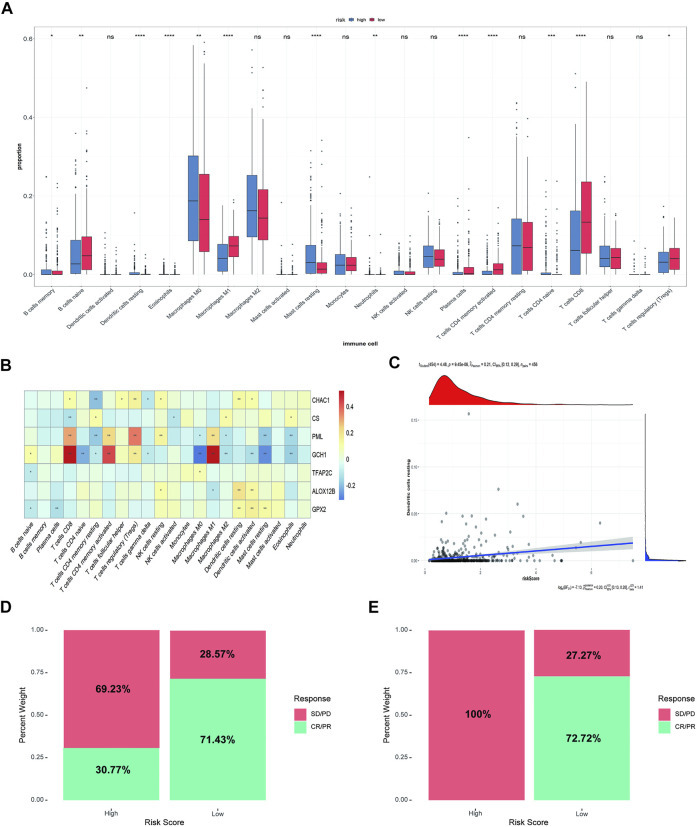
FIGURE 5.
Immune correlation analysis between high-risk and low-risk groups and Comparison of rick scores and chemotherapy drug therapeutic effect. (A) The immune infiltration analysis between risk groups. (B) The correlation analysis between immune cells and 8 ferroptosis-related genes (ns: not significant, *: p ≤ 0.05, **: p ≤ 0.01; ***: p ≤ 0.001). (C) The correlation analysis between risk score and dendritic cells. (D) The distribution of the drug response of samples in the high-risk group and low-risk group in GSE78220 cohort. (E) The distribution of the drug response of samples in the high-risk group and low-risk group in MSKCC cohort.

