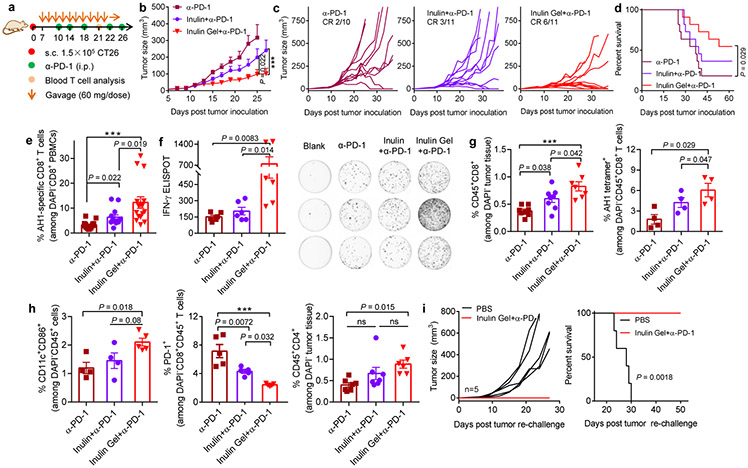
Fig. 5 ∣. Oral inulin gel potently amplifies the therapeutic efficacy of α-PD-1 therapy.
a, Therapeutic treatment regimen. CT26 tumor-bearing BALB/c mice were treated with inulin or inulin gel (each 60 mg/dose) starting day 7, followed by α-PD-1 treatment as indicated. Shown are (b) the average tumor growth curves, (c) individual tumor growth curves, and (d) overall Kaplan-Meier survival curves. e, The average frequency of AH1-specific CD8+ T cells on day 21 and (f) AH-1-specific IFN-γ enzyme-linked immune absorbent spot (ELISPOT) assay on splenocytes isolated on day 23. Tumor tissues were analyzed for the frequencies of (g) CD8+ T cells, AH1-tetramer+ CD8+ T cells, (h) CD11c+CD86+ DCs, PD-1+CD8+ T cells, and CD4+ T cells. i, Survivors in the inulin gel plus α-PD-1 group were re-challenged with 1.5 × 10⁵ CT26 cells inoculated on the contralateral s.c. flank on day 62, followed by tumor monitoring. Data represent mean ± SEM, from a representative experiment (n = 10-11 (b-e), n = 4-7 (f-h), or n = 5 (i) biologically independent animals) from three (b,c) or two (d-i) independent experiments. ***P < 0.001. Data were analyzed by (e-h) one-way ANOVA or (b) two-way ANOVA with Bonferroni's multiple comparisons test, or (d,i) log-rank (Mantel-Cox) test.

