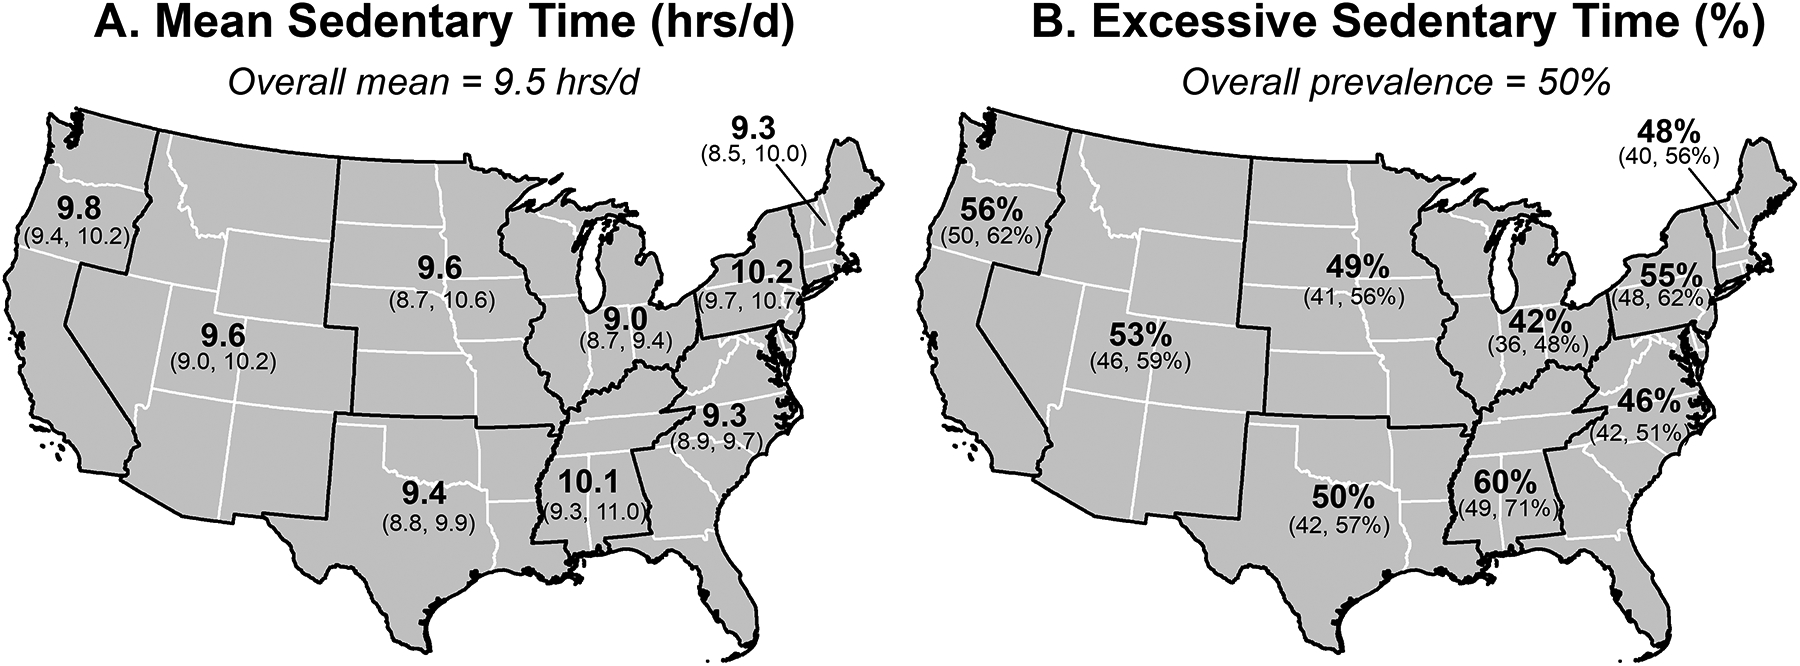
Figure 1.

Time spent in sedentary behavior (hrs/d) and proportion of the population reporting excessive sedentary time (% > 9.5 hrs/d) on a given day—United States adults, October-November 2019.
N=2,640
Values are point estimates (95% confidence intervals [95%CI]).
Nine US Census regions indicated with bold outlines
Linear and logistic regression revealed an association (overall) by region; p=0.01.
Regions with overlapping 95% CI are not significantly different from one another.
