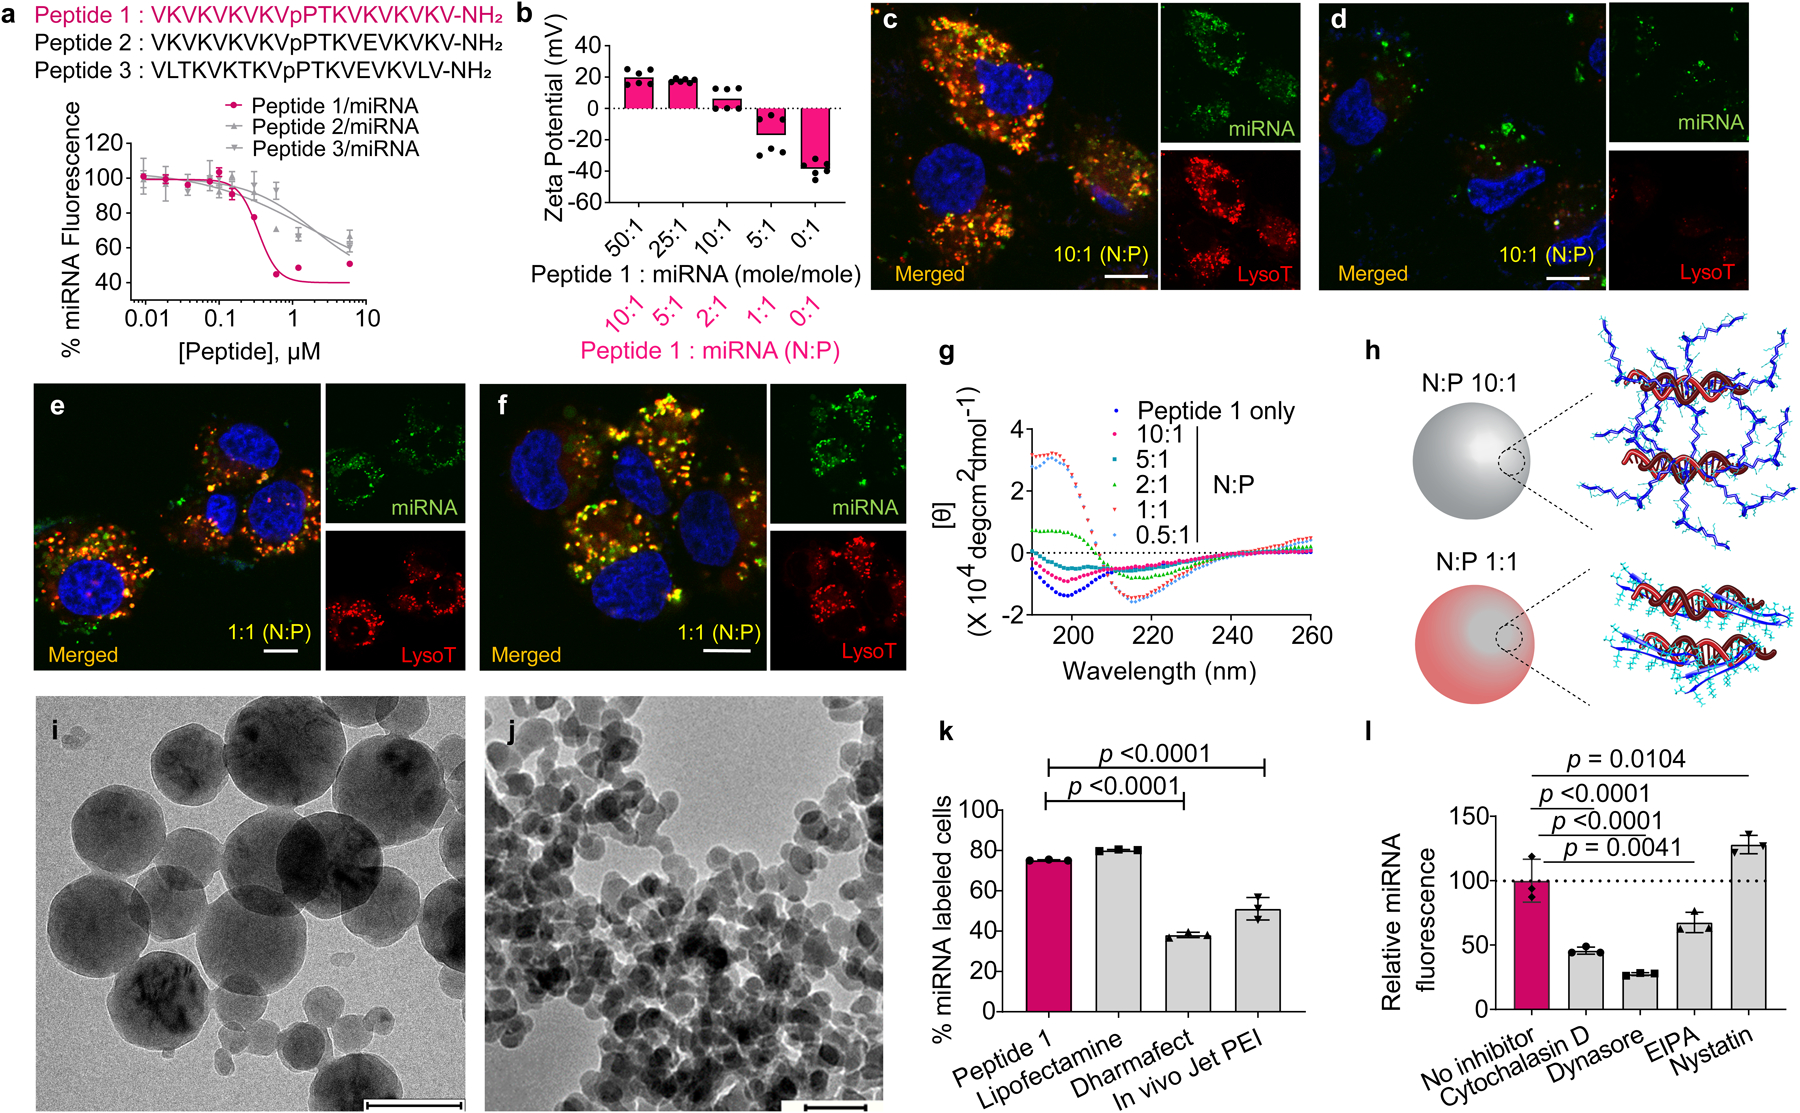
Fig. 2. Engineering, physical characterization and transfection efficacy of miRNA nanoparticles.

a, Sequences of candidate peptides for miRNA particle formulation and binding isotherms for each peptide using FAM-labeled scrambled miRNA. Data = mean ± SD, n = 3 independent samples. b, Zeta potentials of miRNA particles prepared from different mole ratios (and corresponding charge ratio, N:P values) in water at 25 °C. n = 6 measurements over 2 independent experiments. Confocal microscopy of H2052 mesothelioma cells treated for 0.5 h (c) and 4 h (d) with particles containing FAM-miRNA (green, 40 nM final concentration) complexed with Peptide 1 at N:P = 10:1. Corresponding images of cells treated for 0.5 h (e) and 4 h (f) with 1:1 (N:P) particles. Nuclei are stained blue and acidic endosomes are stained red. Scale bar 10 μm for each image. Panels c – f are representative of 3 independent experiments. g, Circular dichroism spectra of Peptide 1 alone and in complex with scrambled miRNA at various N:P ratios, recorded in water at 37 °C. [θ] denotes Mean Residue Ellipticity. Data is representative of 2 independent experiments. h, Models showing conformational state of Peptide 1 bound to miRNA in both 10:1 and 1:1 (N:P) particles. i, Cryo-electron micrographs of 10:1 (N:P) Peptide 1: scrambled miRNA particles. Scale bar 200 nm. j, Cryo-electron micrographs of 1:1 (N:P) Peptide 1: scrambled miRNA particles. Scale bar 100 nm. Uncropped micrograph (Figure S26a). Panels i & j are representative of 2 independent experiments. k, miRNA transfection efficiency of 10:1 (N:P) particles into H2052 cells after 1 h exposure compared to commercially available agents. Data = mean ± SD, n = 3 independent samples, representative of 2 independent experiments. Significant difference was assessed by Ordinary one-way ANOVA & Dunnett’s multiple comparison test. l, cellular transfection of 10:1 (N:P) particles into H2052 cells as a function of endocytic inhibitors. Median fluorescence intensities are normalized to miRNA internalization in the absence of inhibitor. Data = mean ± SD, n = 3 independent samples, representative of 2 independent experiments. Significant difference was assessed by Ordinary one-way ANOVA & Dunnett’s multiple comparison test.
