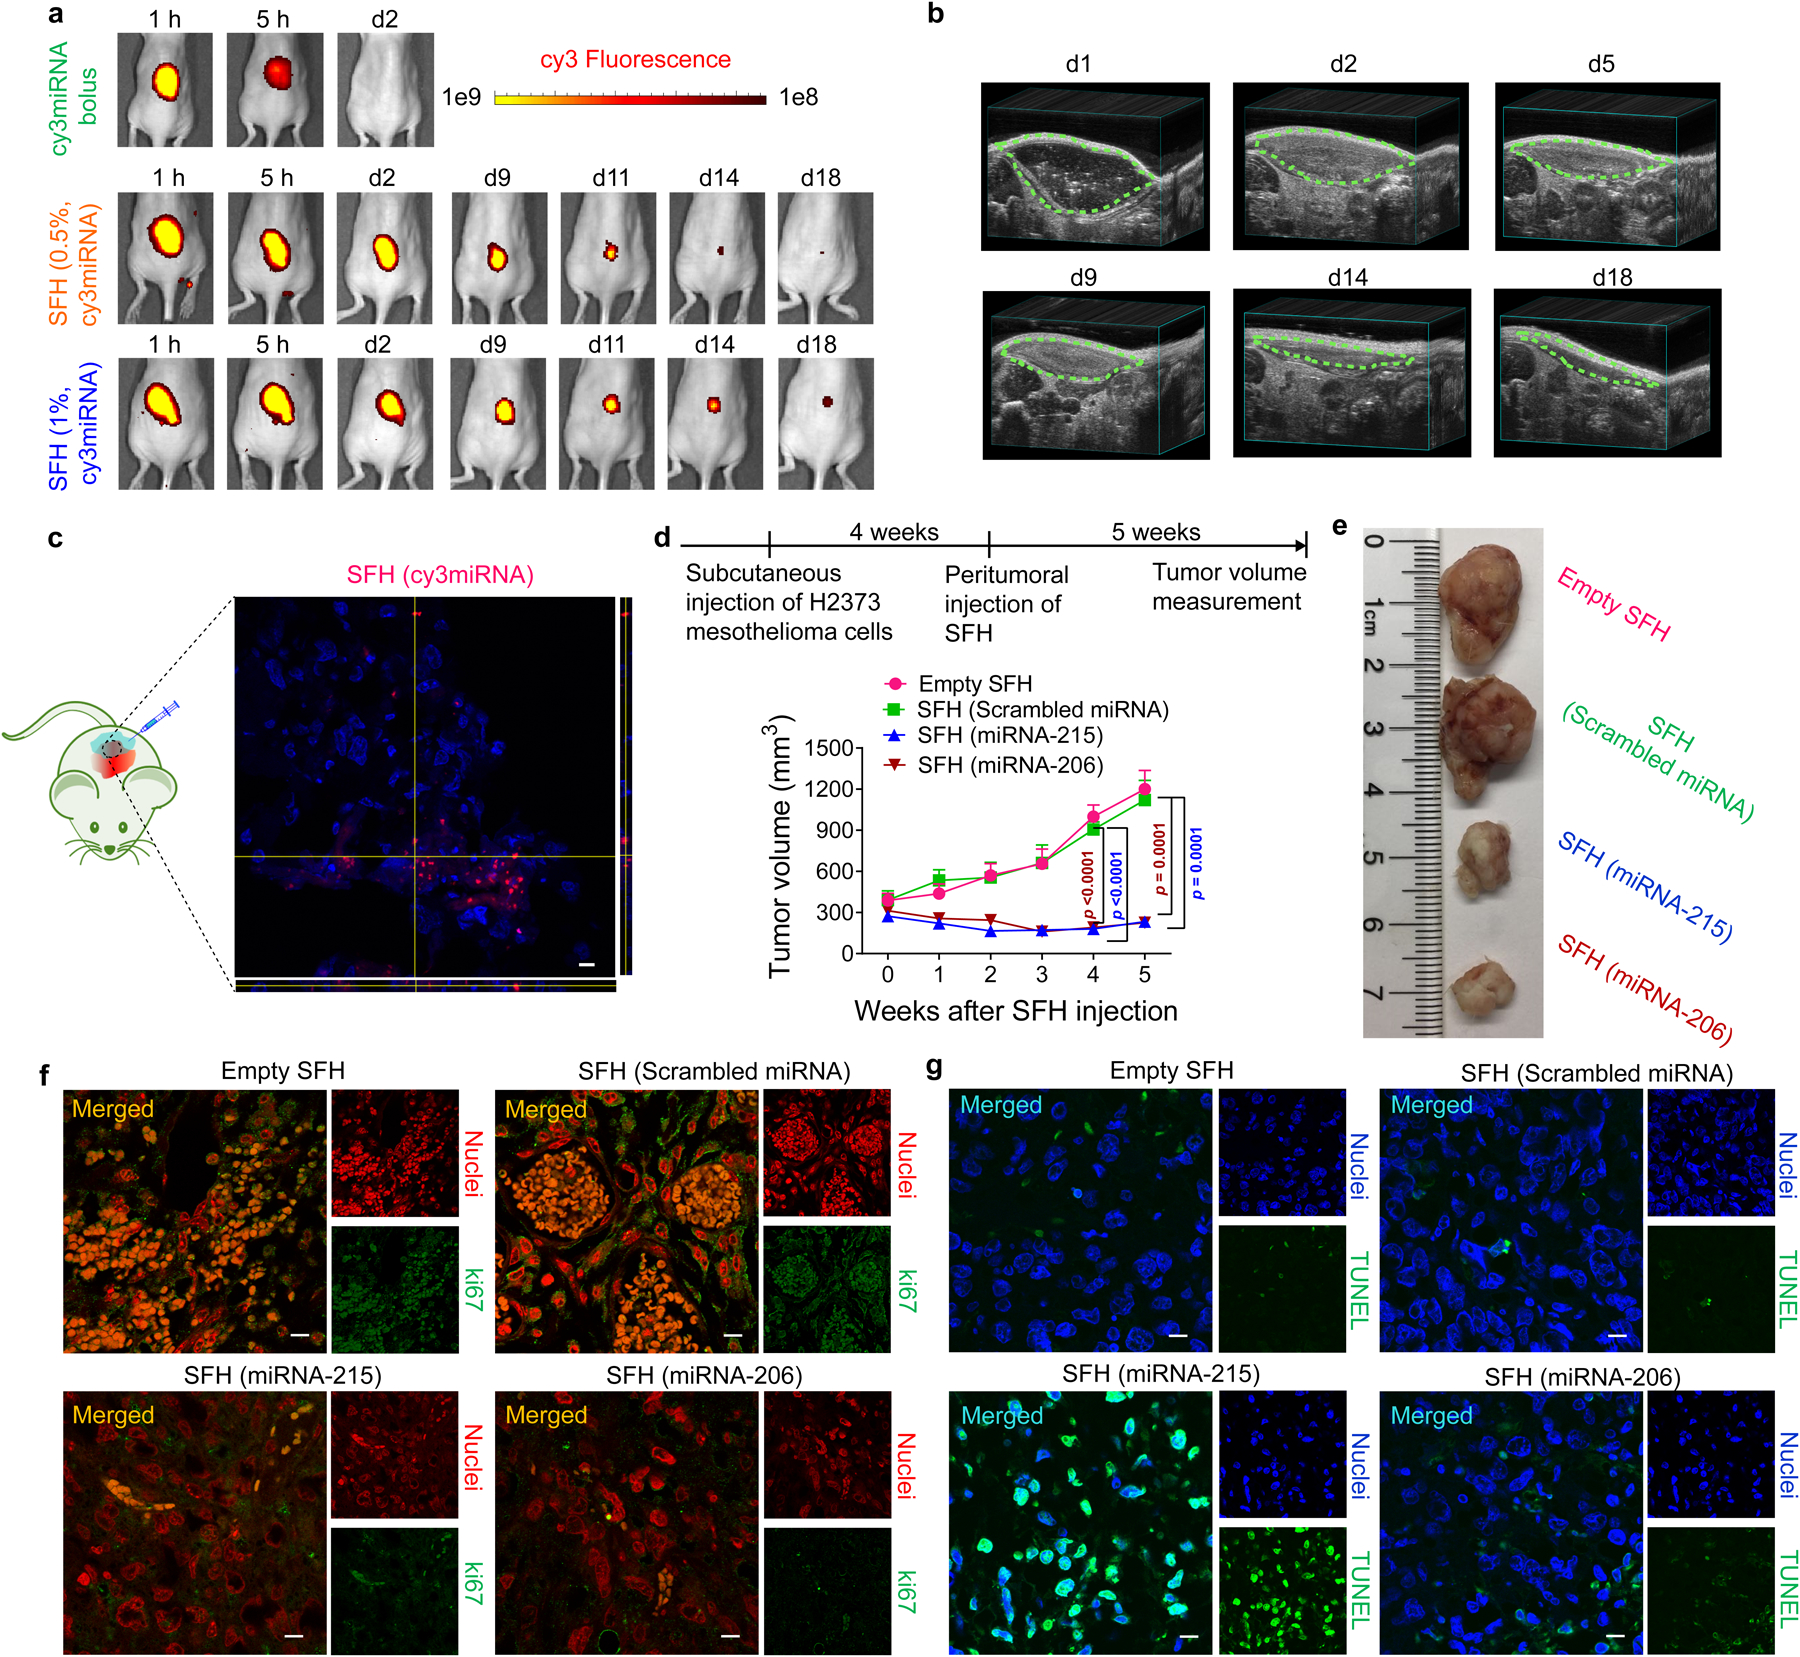
Fig. 5. In vivo delivery and anti-cancer effects of SFH.

a, Local release of Cy3-labeled miRNA nanoparticles from 0.5 and 1 wt% SFH in athymic nu/nu mice versus free miRNA. Data representative of 3 independent animals for SFH groups and 2 animals for miRNA bolus group. b, Biodegradation of 1 wt% SFH monitored by ultrasound. Data representative of 3 independent animals. c, Peritumorally injected SFH delivers miRNA locally to cells in a subcutaneous xenograft. Intracellular fluorescence is observed from H2373 mesothelioma tumor cross-sections from NSG mice at 24 h post injection. Corresponding z-stacks are also shown. Scale bar 10 μm. Data representative of 2 independent experiments. d, Subcutaneous xenograft H2373 tumor volume as a function of time and SFH composition. NSG mice (n = 5 for therapeutic miRNA treated groups, n = 4 for rest) received a single injection of the different SFHs. Data = mean ± SEM. Statistics at week 4 & 5 were derived from surviving mice; for week 4, n = 4 animals for empty SFH group and scrambled miRNA group, n = 5 for rest; for week 5, n = 3 for empty SFH & scrambled miRNA-treated groups, n = 4 for rest, One-way ANOVA with Tukey’s multiple-comparisons test. e, Images of tumors resected from treated mice on week 4 post-SFH injection. Immunohistochemical evaluation of tumor tissue resected from mice treated with various SFH compositions for (f) Ki67, a nuclear marker of proliferative capacity and (g) apoptosis using TUNEL staining. Tumors were collected at 4 weeks post-SFH treatment. Nuclei in panel f were stained with DAPI and pseudo-colored red in ImageJ to aid visualization. Nuclei in panel g are blue. Scale bar 10 μm in each image. Data for (f,g) representative of 2 independent experiments.
