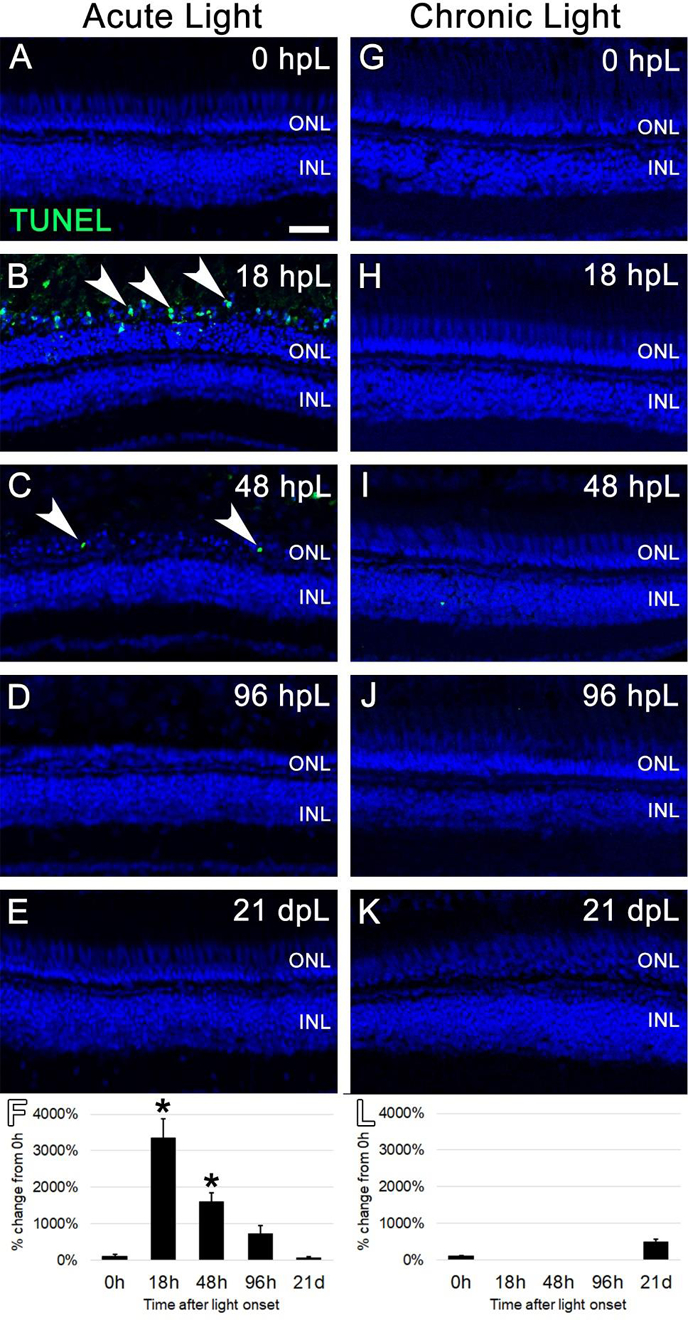
Figure 2. Cell death analysis during acute and chronic light treatments.

In the acute group (A-E), TUNEL-positive apoptotic cells (green; arrowheads) were observed in the outer retina at 18 hpL (B) and 48 hpL (C), at the initial stages of light damage. Graphic representation of the percent-change in TUNEL immunostaining from 0 hpL at each time point (F). In the chronic group (G-K), significant numbers of TUNEL-positive cells were not observed at any time point. Graphic representation of the percent-change in TUNEL immunostaining from 0 hpL at each time point (L). hpL: hours post light onset; ONL: outer nuclear layer; INL: inner nuclear layer; asterisk: significantly different from 0 hpL (p<0.05) as determined by post-hoc Tukey test from one-way ANOVA (N=5–6 retinas per time point). Scale bar=25 microns.
