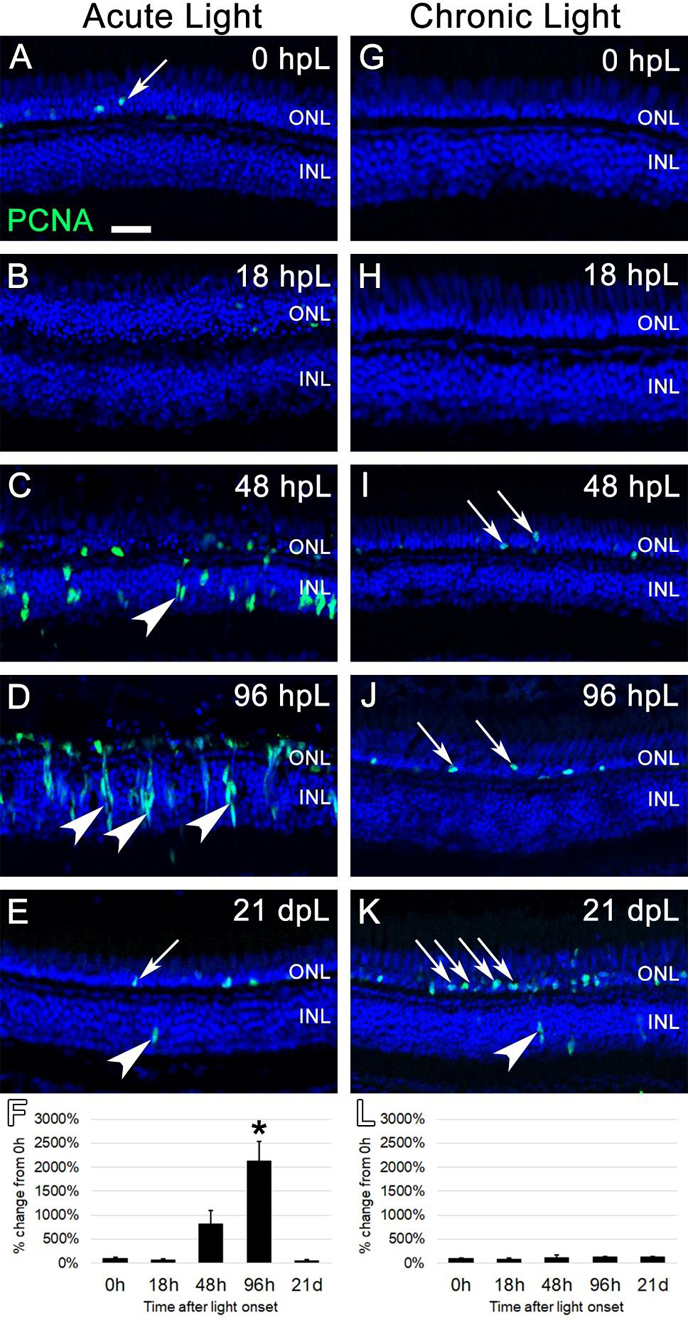
Figure 4. Analysis of Müller glia and progenitor cell proliferation during acute and chronic light treatments.

In undamaged retinas (A and G), Proliferating Cell Nuclear Antigen (PCNA) immunostaining (green) was only observed in an occasional rod precursor cell in the outer nuclear layer (A, arrow), contributing to the constant neurogenesis of rod photoreceptors. In the acute group (A-E), significant numbers of individual PCNA-positive cells were first observed at 48 hpL (C), representing Müller glia cells that have re-entered the cell cycle (arrowhead). By 96 hpL (D), larger columns of progenitor cells have formed (arrowheads), and the migration of PCNA-positive progenitor cells to the depleted outer nuclear layer was evident. At 21 dpL (E), PCNA expression had returned to near baseline levels, with the occasional observance of PCNA-positive rod precursors (arrow) and Müller glia (arrowhead). Graphic representation of the percent-change in PCNA immunostaining from 0 hpL at each time point (F). In the chronic group (G-K), large numbers of PCNA-positive Müller glia or progenitors were never observed. Qualitatively, there appeared to be a gradual increase in PCNA-positive rod precursor cells (arrows) starting at 48 hpL (I) and increasing at 96 hpL (J) and 21 dpL (K); however, this expression change did not reach significance based on the overall intensity of staining (L). Graphic representation of the percent-change in PCNA immunostaining from 0 hpL at each time point (L). hpL: hours post light onset; ONL: outer nuclear layer; INL: inner nuclear layer; GCL: ganglion cell layer; asterisks in F and L: significantly different from 0 hpL (p<0.05) as determined by post-hoc Tukey test from one-way ANOVA (N=5–6 retinas per time point). Scale bar=25 microns.
