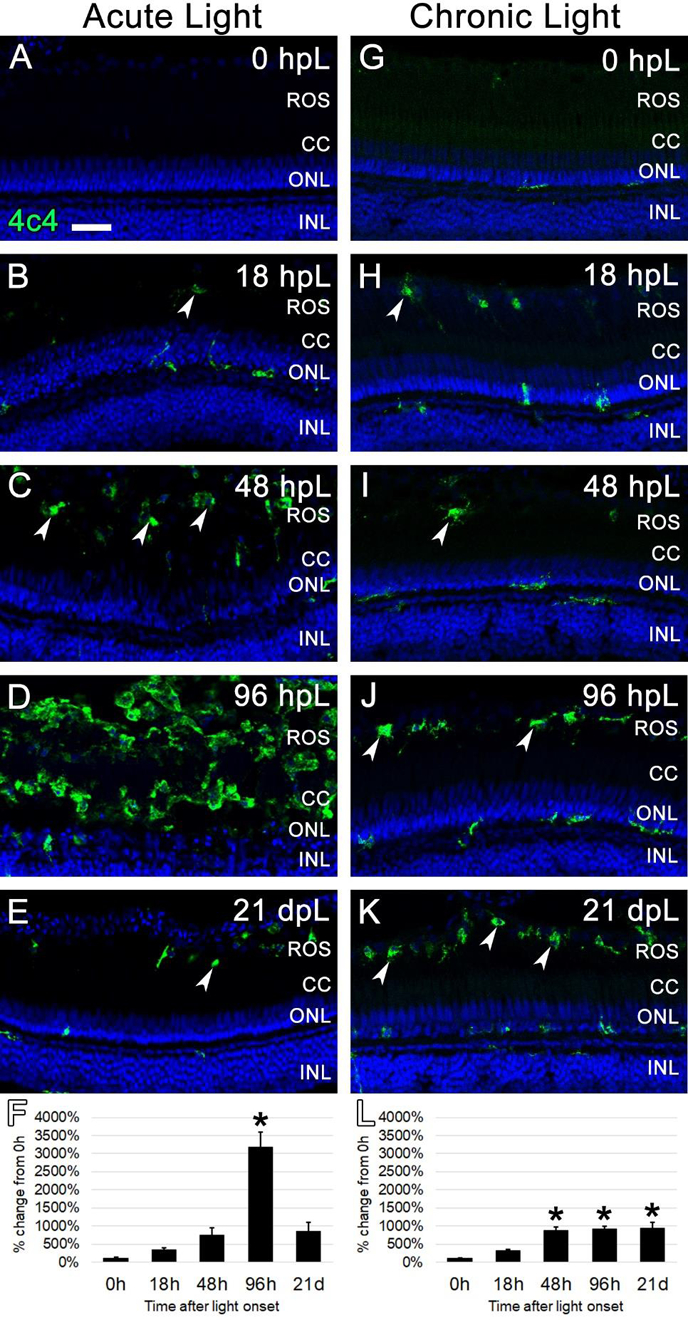
Figure 7. Analysis of microglial response to photoreceptor degeneration/regeneration during acute and chronic light treatments.

In undamaged retinas (A and G), 4c4 immunocytochemistry (green) labeled occasional quiescent microglia with ramified morphology. In the acute group (A-E), 4c4 immunolabeled occasional activated microglia with amoeboid morphology in the ROS starting at 18 hpL (B, arrowheads). These activated microglia increased in number through 48 hpL (C). At 96 hpL (D), a large field of amoeboid microglia were present in an area that corresponded to rhodopsin photoreceptor debris. At 21 dpL (E), 4c4+ microglia had returned to near baseline levels, although a few remained at the interface of the rod outer segments and the retinal pigmented epithelium (arrowhead). Graphic representation of the percent-change in 4c4 immunostaining from 0 hpL at each time point (F). In the chronic group (G-K), 4c4+ microglia with amoeboid morphology were observed in the area of ROS starting at 18 hpL (H, arrowheads). These increased in number by 48 hpL (I) and then were maintained at the ROS/RPE interface through 96 hpL (J, arrowheads) and 21 dpL (K, arrowheads). Graphic representation of the percent-change in 4c4 immunostaining from 0 hpL at each time point (L). hpL: hours post light onset; ROS; rod outer segments; CC; cone cell nuclei; ONL: outer nuclear layer; INL: inner nuclear layer; asterisks in F and L: significantly different from 0 hpL (p<0.05) as determined by post-hoc Tukey test from one-way ANOVA (N=5–6 retinas per time point). Scale bar=25 microns.
