
FIG. 2.
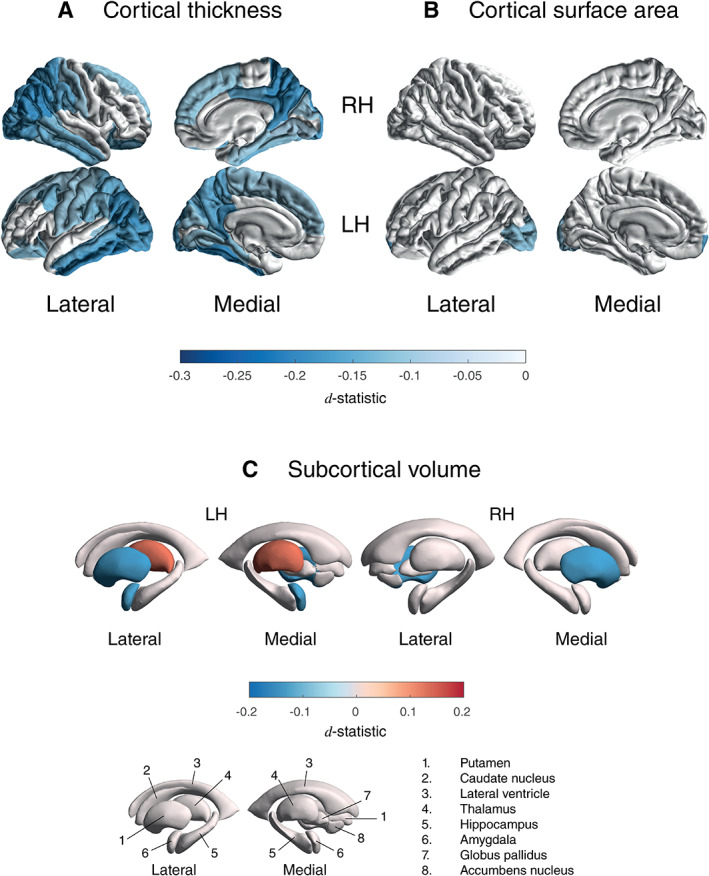
Cortical thickness, cortical surface area, and subcortical volume group differences for Parkinson's disease patients versus controls. D‐statistic effect size estimates for mean differences in (A) cortical thickness, (B) cortical surface area, and (C) subcortical volume. A negative d‐value indicates smaller measurements in Parkinson's disease patients. Cortical regions with P < 7.35 × 10⁻⁴ (ie, 0.05/68 ROIs) are depicted in the heat‐map colors. Subcortical regions with P < 3.13 × 10⁻³ (ie, 0.05/16 ROIs) are depicted as in the heat‐map colors. RH, right hemisphere; LH, left hemisphere; ROI, region of interest, L, left; R, right; n., nucleus. [Color figure can be viewed at wileyonlinelibrary.com]