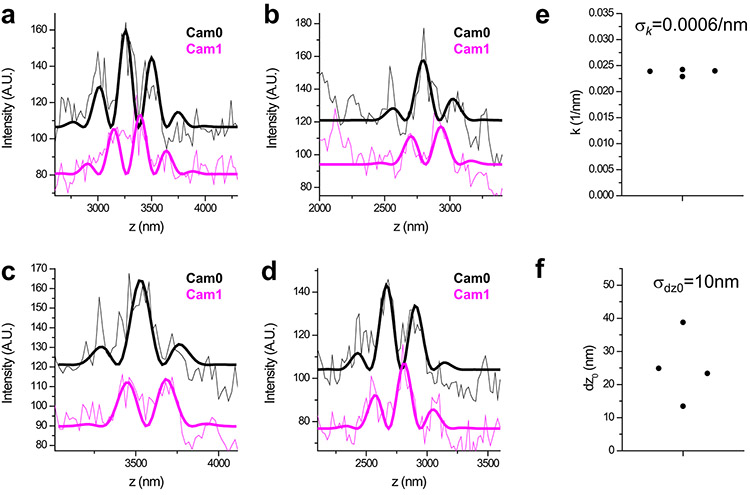
Extended Data Figure 4. Localization of Brd4 clusters in reconstructed 3D-iLLS images.
a-d, Axial profiles of individual Brd4 clusters. Thick lines show non-linear least-squares fits to equations of the form for Cam0 and Cam1, respectively. Global fitting is performed, with shared k,θ and σz parameters. We obtain two separate localization measurements of the parameter z0 that indicates the center position of the cluster, estimated independently from Cam0 and Cam1. e, Oscillation wave-vector k is 0.02375±0.00059 nm−1 (mean±SD), indicating a relative error σk/k of ≈2.5%. f, The center position z0 shows a systematic offset between the two cameras of dz0=25nm and an r.m.s localization error σdz0=10 nm. These systematic and random errors relative to the oscillation period (2π/k=265nm) are ≈9% and ≈4% respectively.

