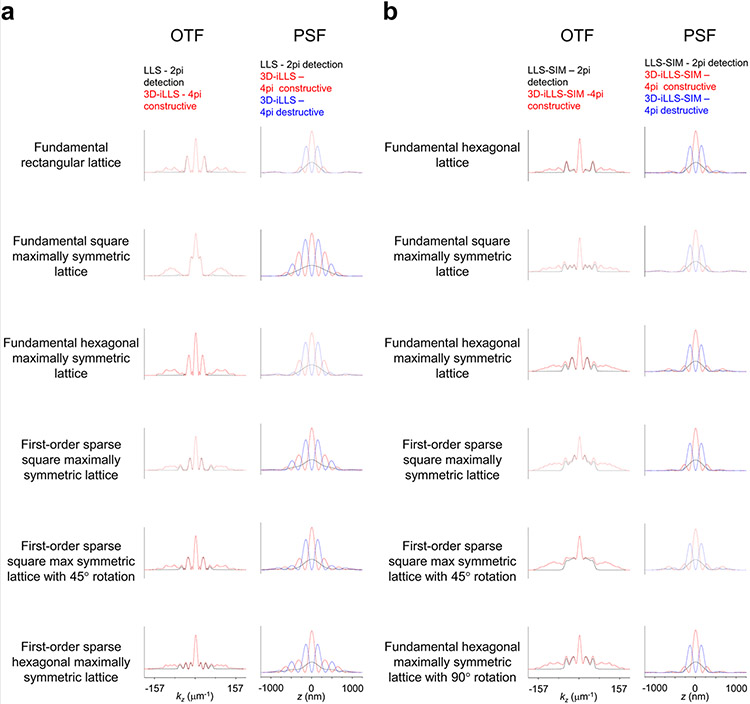
Extended Data Figure 7. Line profiles of OTFs and PSFs obtained by conventional LLS, 3D-iLLS, conventional LLS-SIM and 3D-iLLS-SIM.
a, conventional LLS and 3D-iLLS based on dithered LLS excitation. b, conventional LLS-SIM and 3D-iLLS-SIM based on SIM LLS excitation. Line profiles along the kz axis (kx=0, ky=0) and z axis (x=0, y=0) are shown for OTFs and PSFs, respectively. Simulation parameters are given in Supplementary Tables 1 and 2.

