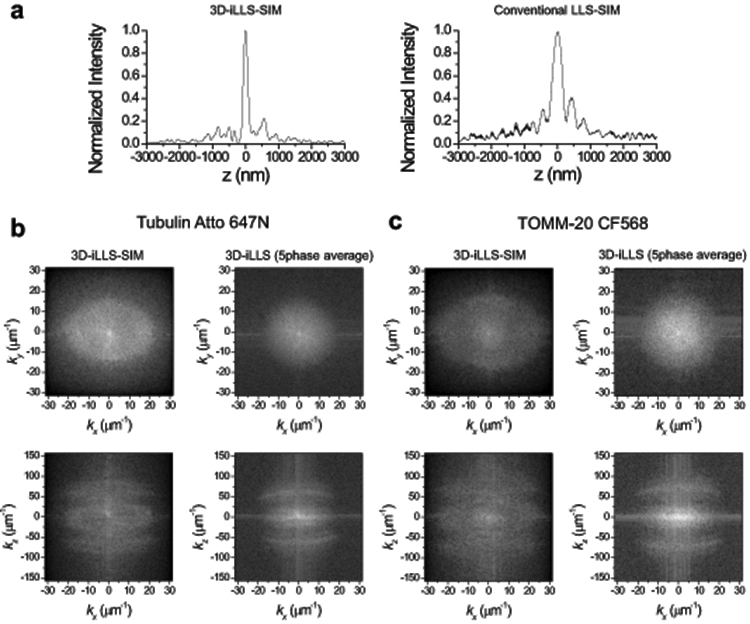
Extended Data Figure 8. Resolution and recovery of spatial frequencies of conventional LLS-SIM vs. 3D-iLLS-SIM.

a, Conventional LLS-SIM vs. 3D-iLLS-SIM of microtubules. Average z profile obtained from n=9 and 7 individual microtubules from the 3D-iLLS-SIM and conventional LLS-SIM data in Figure 3a. b,c, Fourier transforms of 3D-iLLS-SIM vs. 3D-iLLS images of microtubules and mitochondria. Fourier transforms S(k) correspond to the real-space data shown in Figure 4a. Maps show log(∣S(k)∣) in the kxky and kxkz planes. 3D-iLLS data are obtained from the 3D-iLLS-SIM data by 5-phase averaging. Two experiments were repeated independently with similar results.
