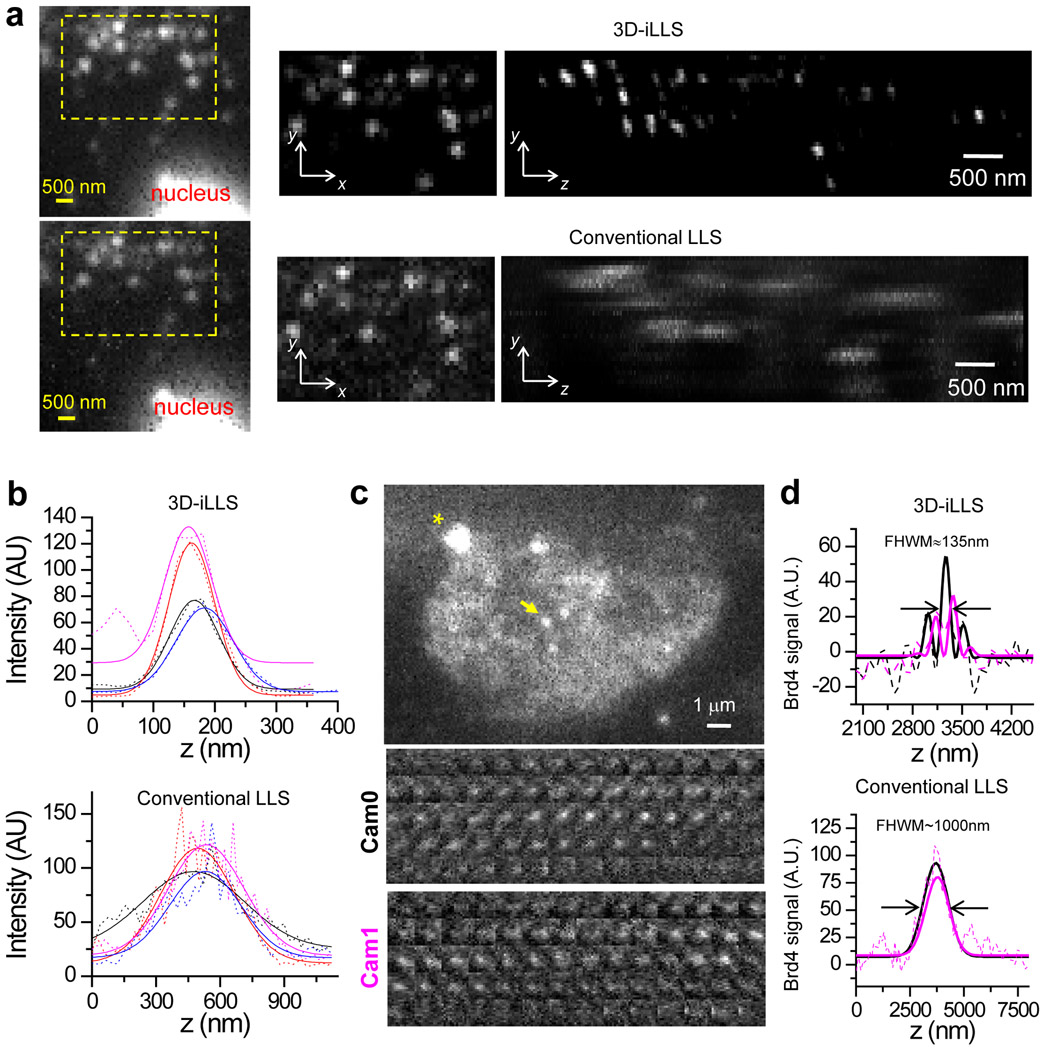
Figure 2. 3D-iLLS outperforms conventional LLS in 3D sub-cellular imaging.
a, Comparison of 3D-iLLS vs. conventional LLS for imaging 24×PP7 mRNAs tagged with tdPCP-Halo-JF646 in fixed U-2 OS cells. yx, zx, and yz maximum projections. b, z profiles of single mRNAs (dashed lines) and 1D Gaussian peak fits (solid lines), showing increased axial resolution for 3D-iLLS vs. conventional LLS. c, 3D-iLLS image of Brd4 clusters in live mESCs. A single z slice from the raw data is shown. Asterisk marks a bead fiducial. Insets show individual z slices for the cluster indicated by the yellow arrow (3D-iLLS data, 20 nm z steps). d, z profiles (background-subtracted, using a band-pass FFT filter) of single Brd4 clusters imaged with conventional LLS and 3D-iLLS. Solid lines: non-linear least-squares fit to 1D Gaussian peaks for conventional LLS and to equations of the form for 3D-iLLS, for Cam0 and Cam1 respectively. Zoomed-out panels in a and panels in c, d show raw data without deconvolution. Data for boxed regions in a and in b are shown after deconvolution. Two experiments were repeated independently with similar results, for a-d.

