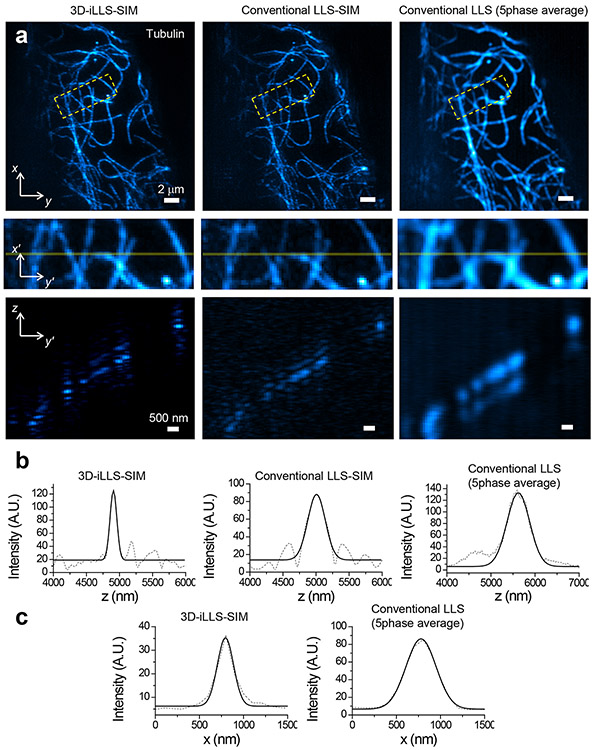
Figure 3. 3D-iLLS-SIM enables cellular imaging with improved resolution compared to conventional LLS-SIM and dithered LLS.
a, Top and middle panels: maximum intensity projections of Atto 647N immunostained microtubules in a fixed COS-7 cell. Bottom panels: slice of the data in the plane indicated by the transparent yellow lines. b, Line profiles of individual microtubules in z. c, Line profiles of individual microtubules in x. b-c, Dashed lines: raw data; solid lines: 1D Gaussian peak fits. Fitted z FWHM widths are 122 nm, 311 nm, and 603 nm, for 3D-iLLS-SIM, and for conventional LLS-SIM and LLS (5-phase average), respectively. Fitted x FWHM widths are 216 nm and 401 nm, for 3D-iLLS-SIM and conventional LLS (5-phase average), respectively. Three experiments were repeated independently with similar results.

