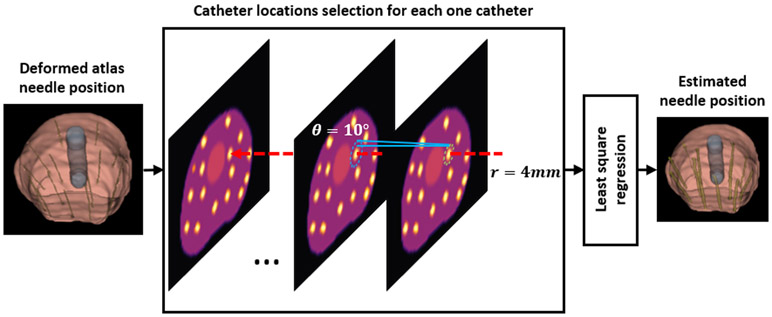
Figure 3.
Schematic flow chart of the needle regression step used in the proposed method. The green dashed circle denotes the circle region which centered at one needle position of the most left axial slice of deformed atlas needle mask image. The radius for this circle is set to r = 4mm. Then, for next slice, the searching region is shown by the blue dashed circle. The blue dashed circle has same center with the previous green dashed circle, but with a larger radius r′ = r + d∙tanθ, where θ denotes the angle threshold along z-axis and is set by θ = 10°, d denotes the slice thickness. The red dashed arrow denotes one regressed catheter.

