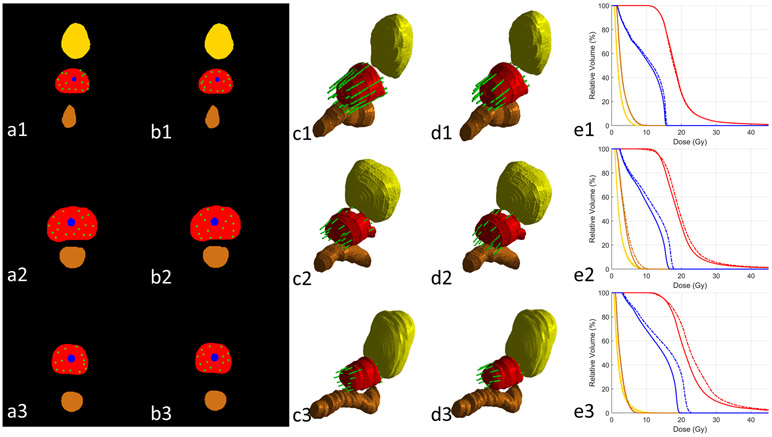
Figure 4.
The comparison between clinical and predicted catheter placements and their resultant DVHs of three representative cases (row (1), (2) and (3)). Columns (a) and (b) show the 2D clinical and predicted catheter placements at the central slice of prostate. Columns (c) and (d) show the 3D rendering clinical and predicted catheter placements. Column (e) demonstrate the DVHs of treatment plans from clinical (solid lines) and predicted (dashed lines) catheter placements. Red: prostate; yellow: bladder; brown: rectum; blue: urethra; green: catheter.

